Power BI for the Energy sector (revisited)!!: Power BI and Data Analytics for Enviro’s (July 2021)
The "Power BI and Data Analytics for Enviros" meetup group is all about sharing tips, tricks and hacks for analysing, visualising and communicating environmental data. The purpose of this blog is to summarise the key take-aways from each of the presenters, to help with sharing knowledge, empowering others and creating a strong data culture within our community.
🎦 Check out the full event recording here 🎦
In July, Joel Gallagher presented on “Solar Panels & Power BI: one homeowners attempt to make sense of the data. After installing his shiny new home solar system, Joel was keen to to dig deeper into its data and performance. In this talk he goes through the process of extracting the usage data and finding insights via Power BI. Mim Djouallah also presented on building his dashboard to track fluctuations in the Australian energy market (excluding WA), available here http://nemtracker.github.io/.
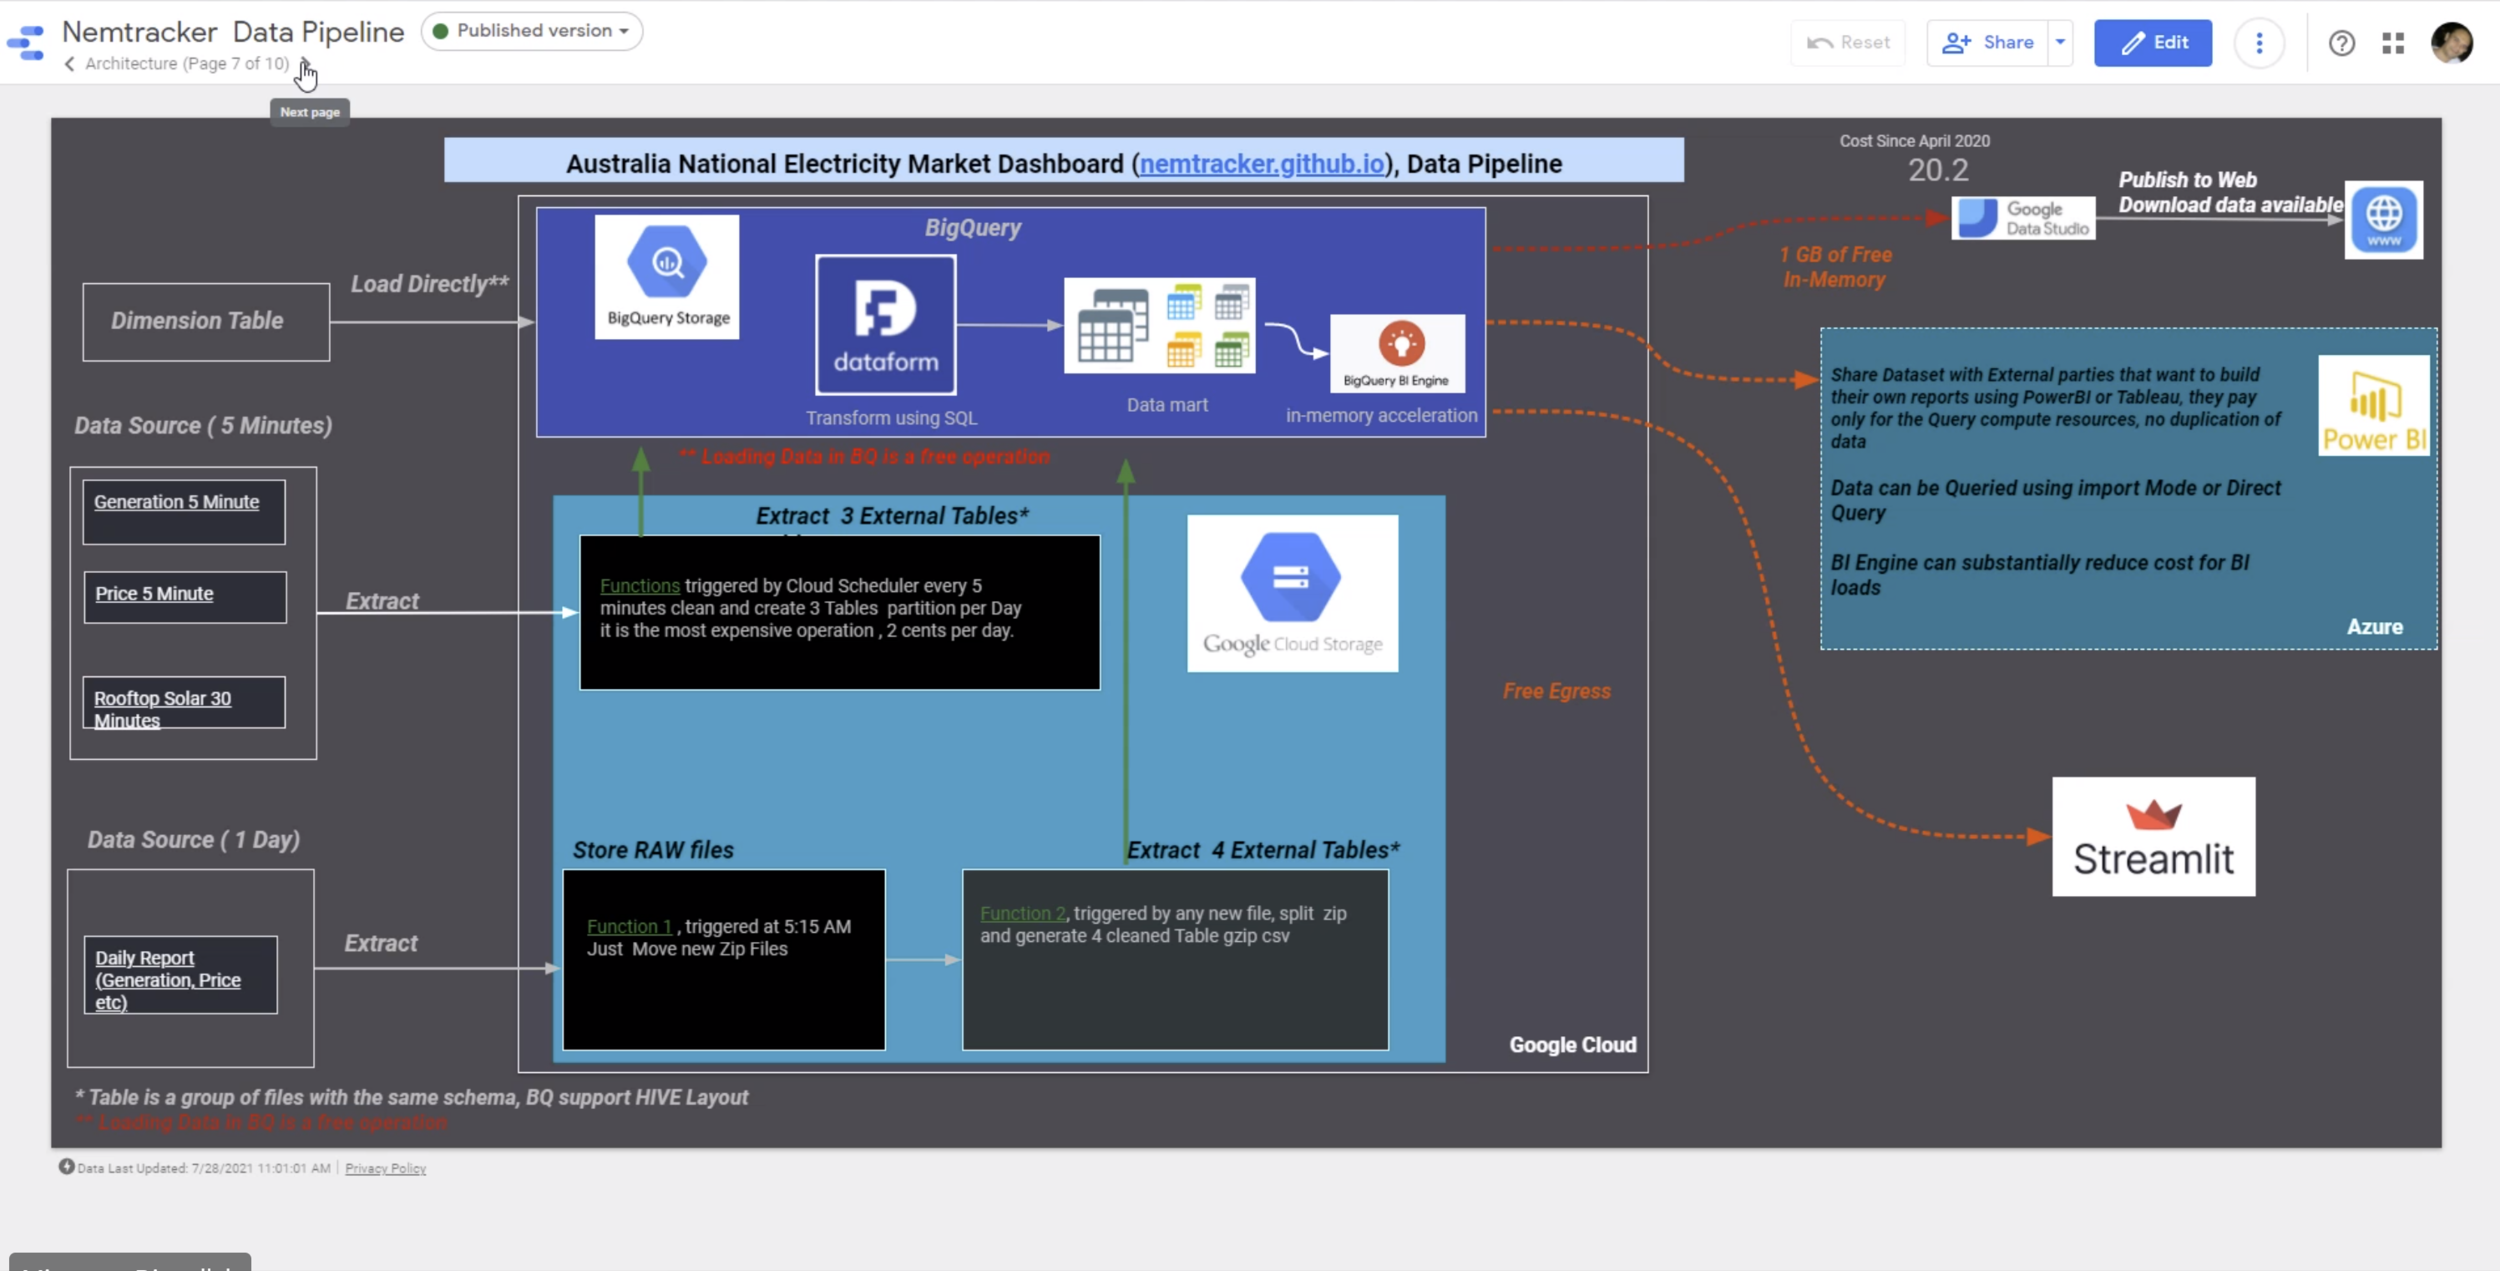
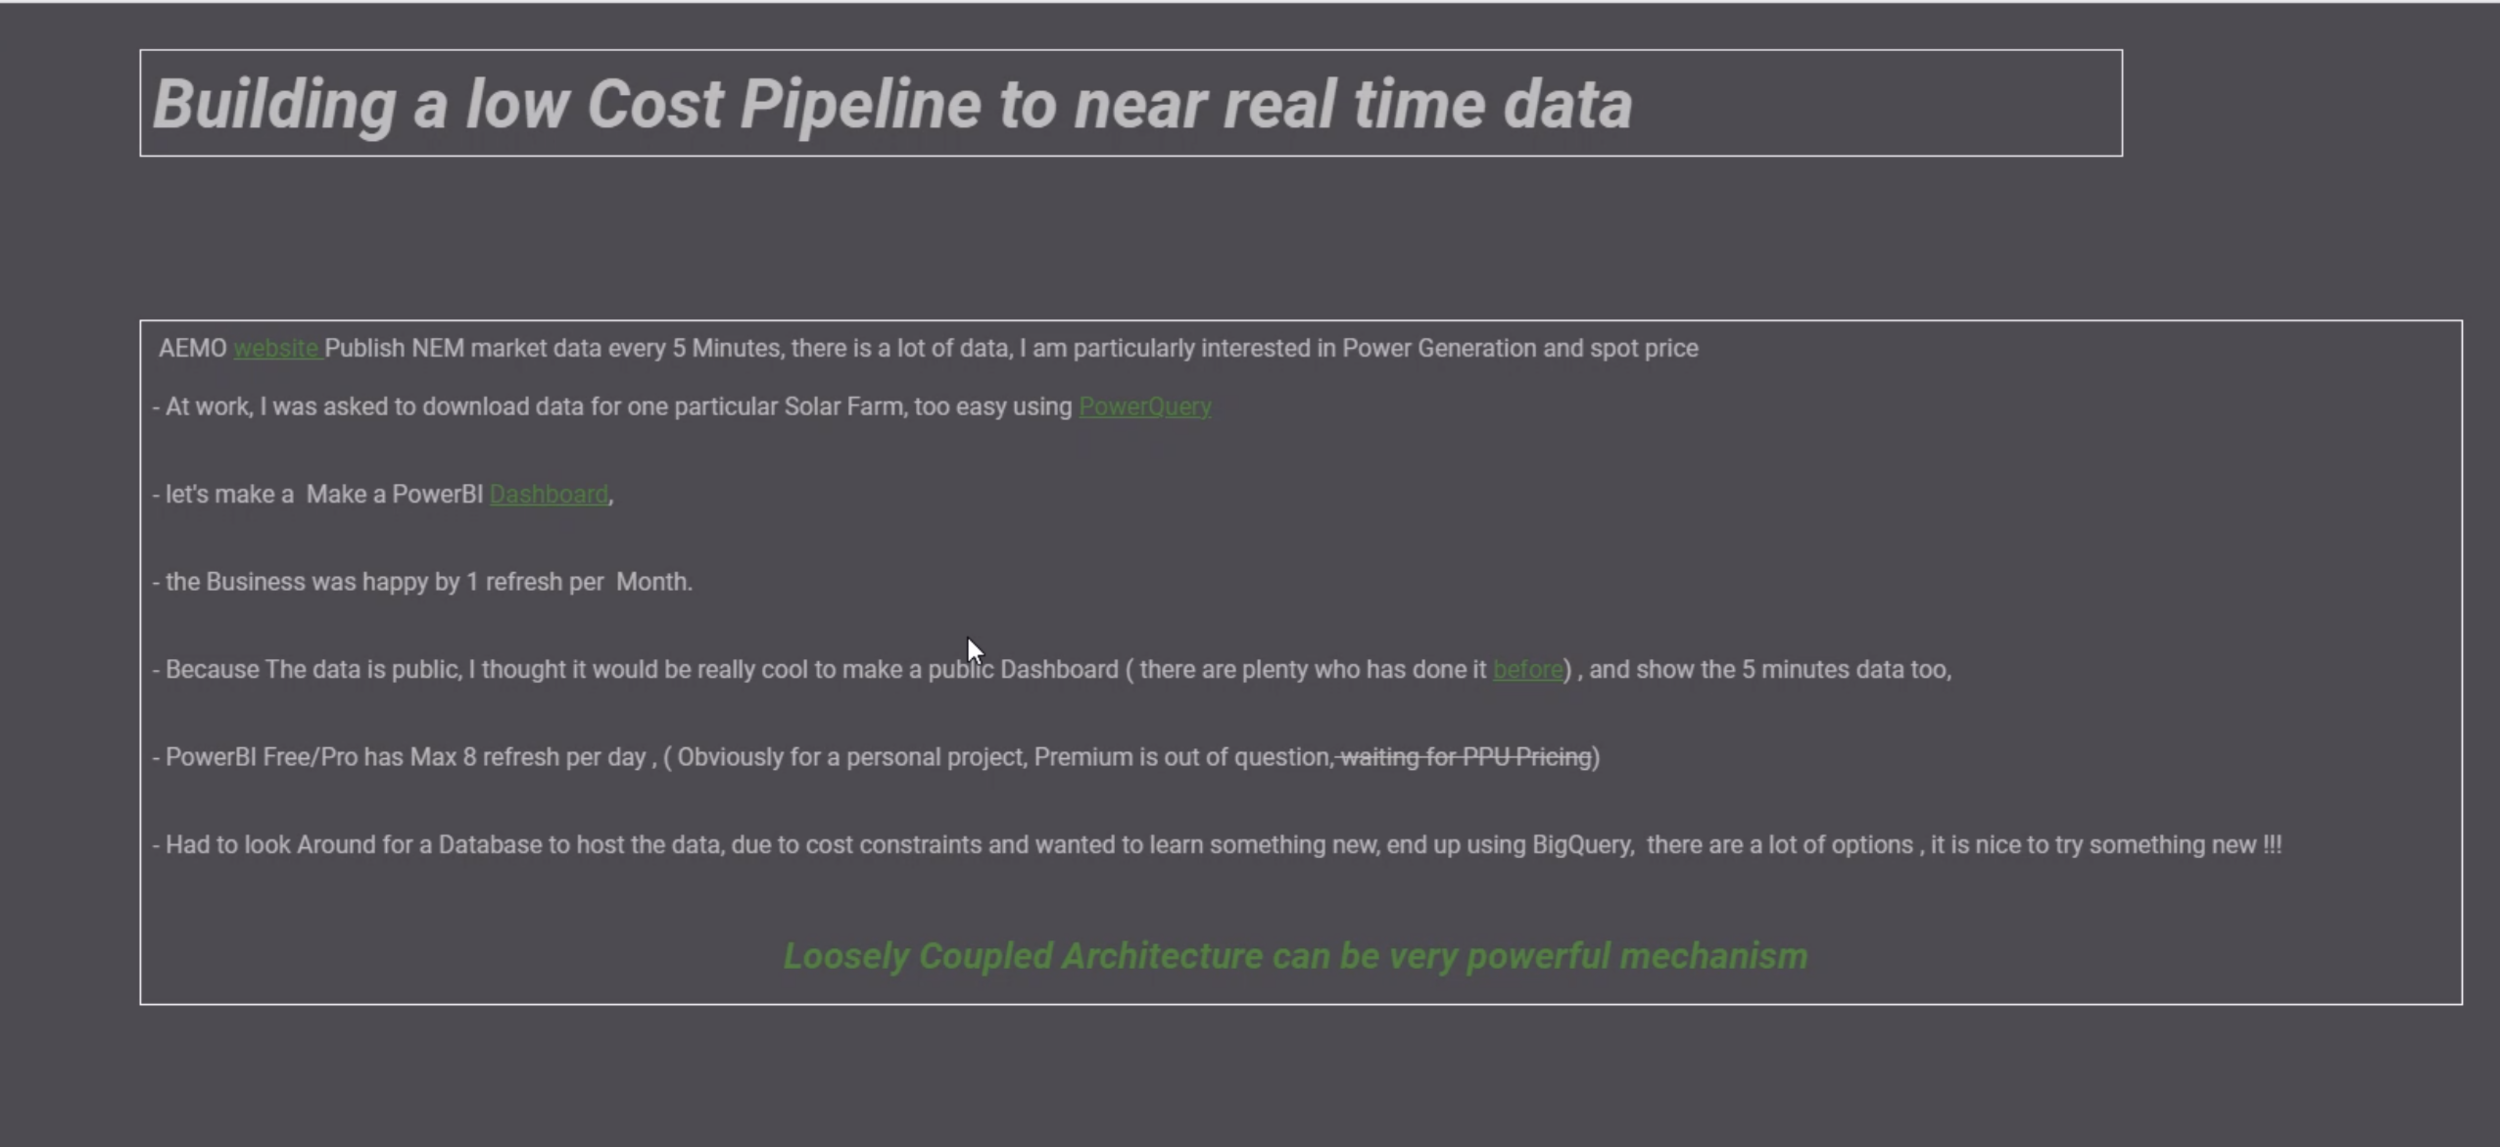
For the project Mim needed to extract data that changed every 5 minutes. At that time Power BI Premium Per User (PPU) licensing was not available, thus his team ended up using BigQuery as a low-cost solution (less than $1/month). This demonstration walked through the approach used to build the ETL process (Storage, Python Functions, Dataform, and BigQuery ). And taking advantage of using a database to centrally store data, Mim showed different scenarios on how to visualize the results in Power BI/ Streamlit/ Google Data Studio.
You can watch the entire recording in the video above, or skip ahead to the sections that interest you by clicking on the individual videos below. The blog is connected to our Meetup group and YouTube channel recording, so we would LOVE to have you subscribe to these and become part of our growing community 😊.
A Solar “Power BI“ Report
Joel Gallagher (Senior Consultant - Servian)
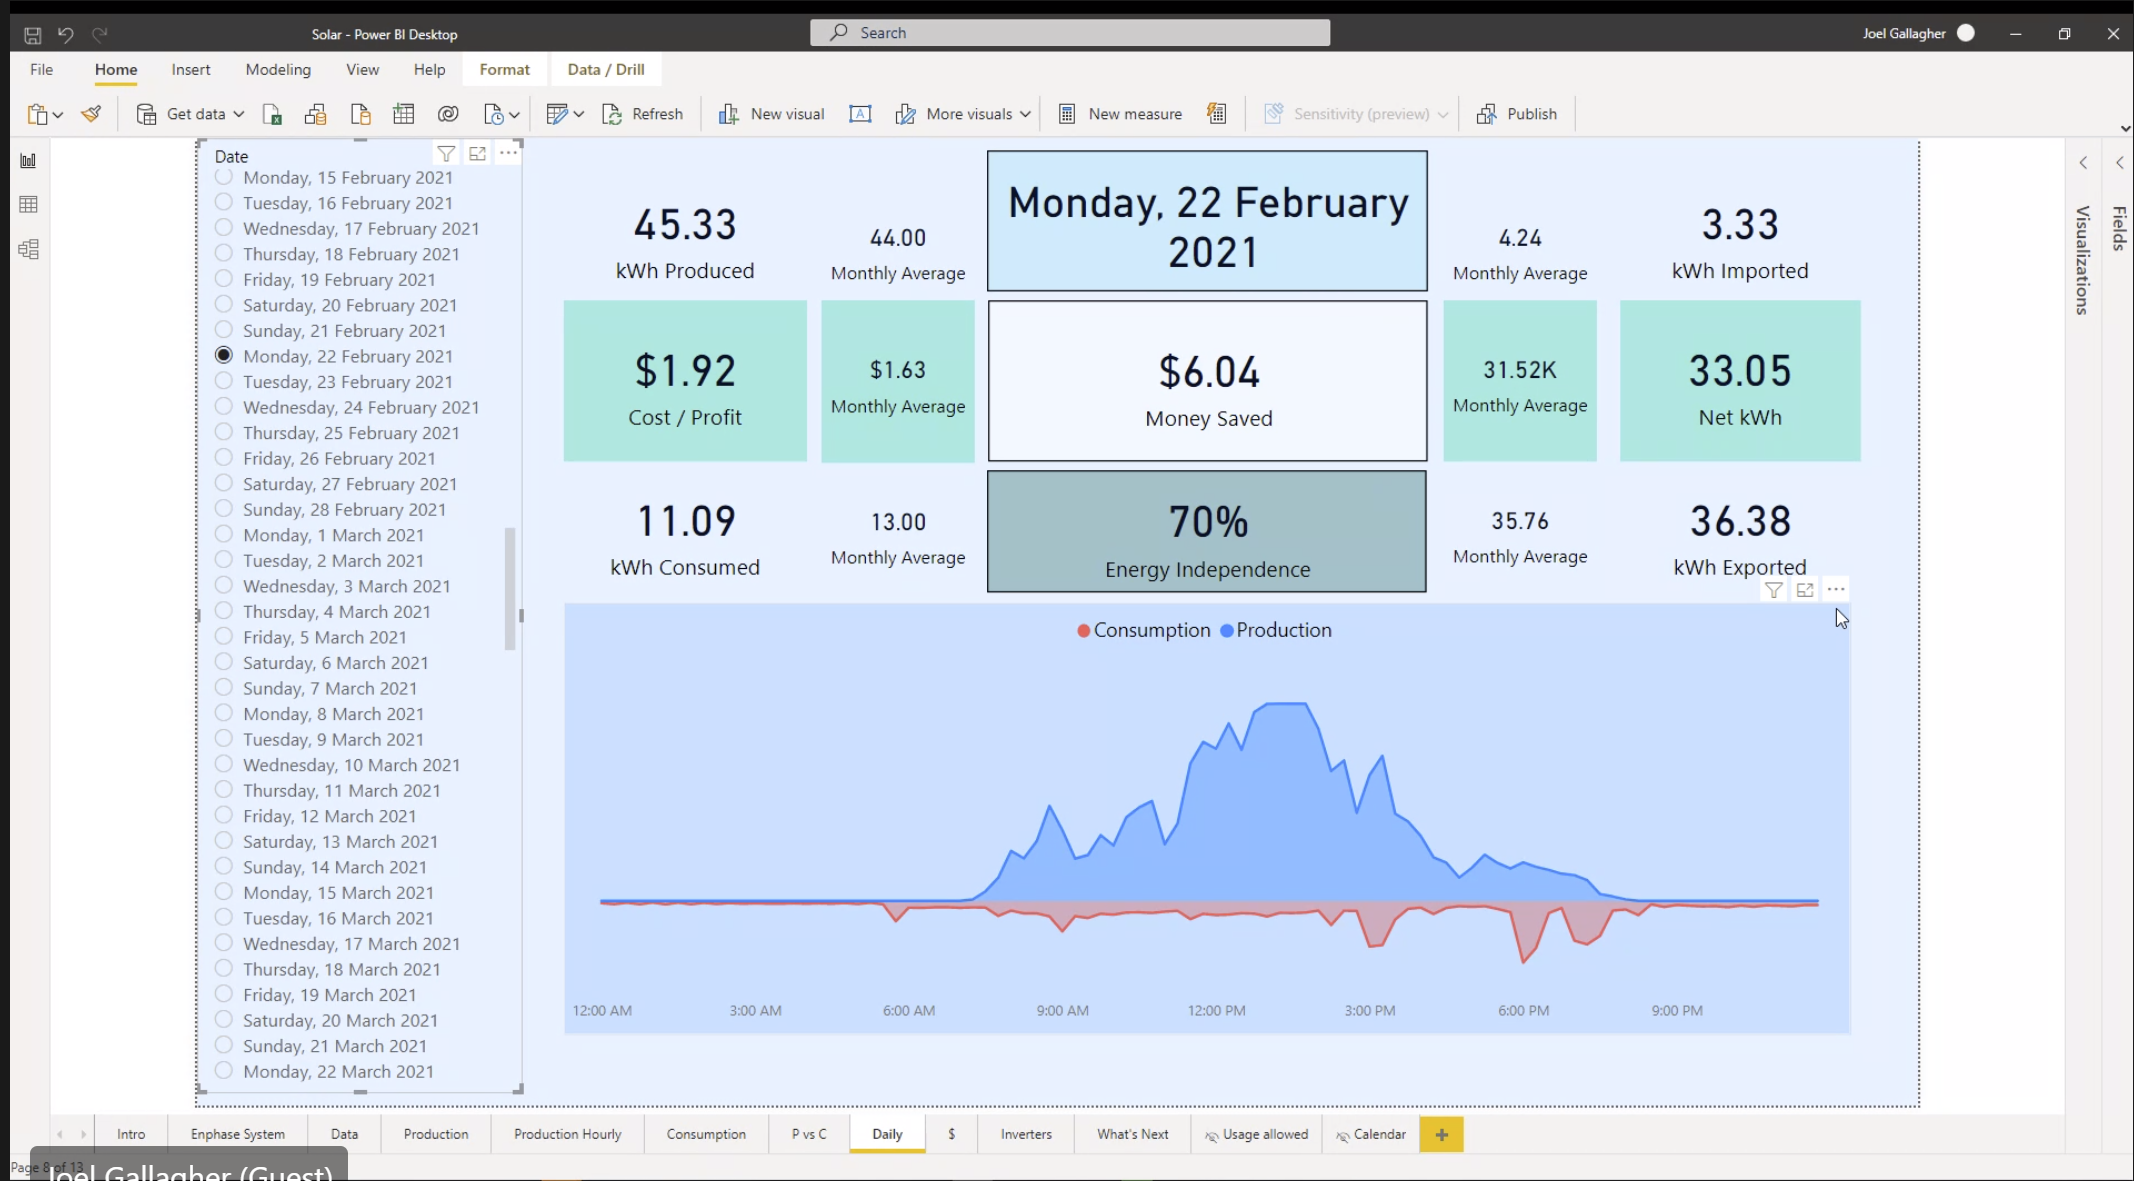
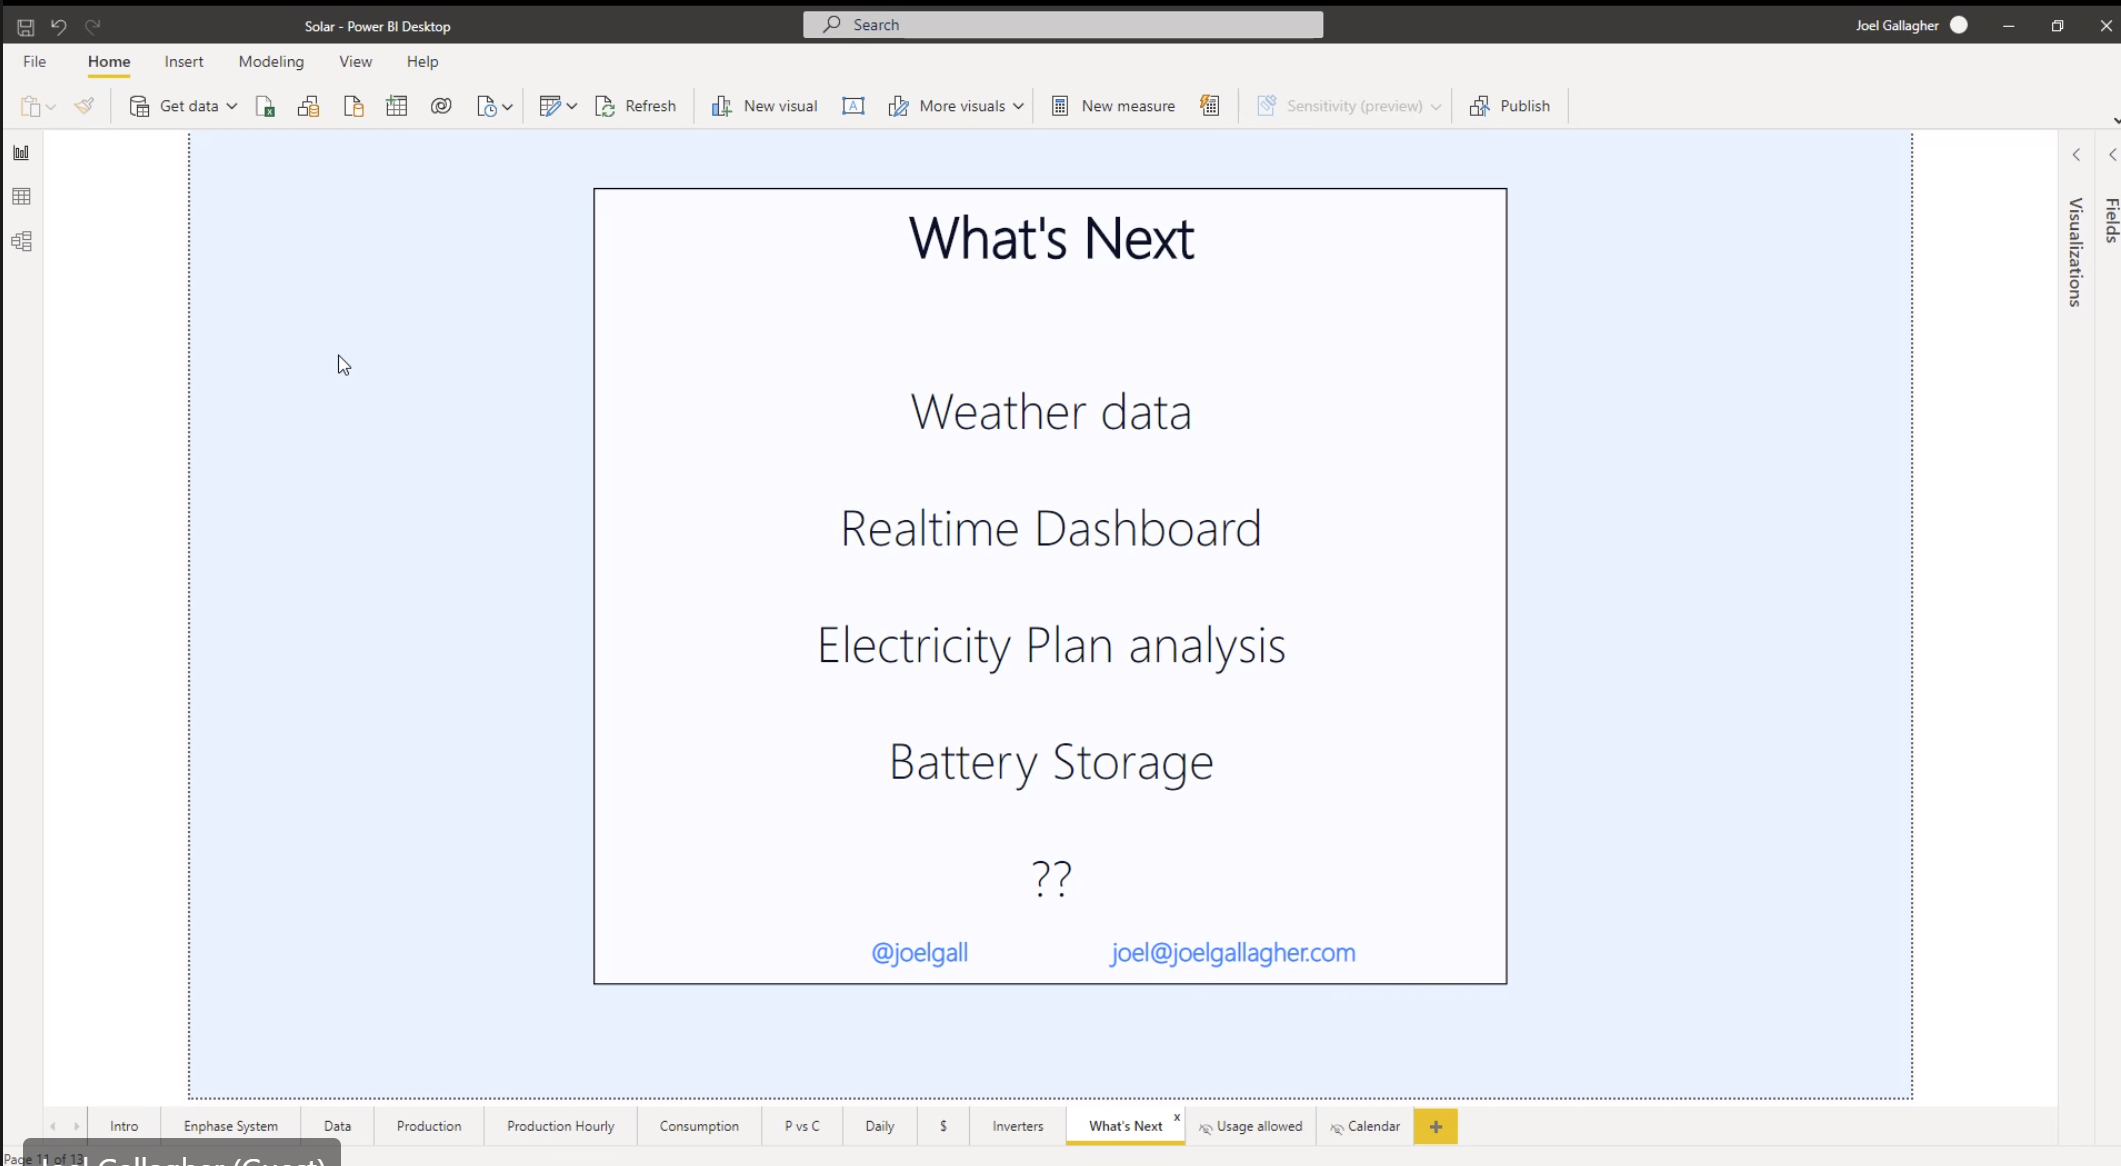
Joel discussed his home solar Power BI report, the idea behind the development and reasons why measuring and visualising your energy output is important. You can watch Joel’s session in the recording above and a few pictures on the report are below.
Australia’s Electricity Market
Mimoune Djouallah
In this part of the video Mim took us through his BigQuery dashboard used to assess fluctuations in Australia’s energy market. The dashboard is available for viewing here: http://nemtracker.github.io/ and Mim’s presentation here: https://datastudio.google.com/u/0/reporting/88b5ee5a-21df-47f5-80c8-232c65a134dd/page/lEIuB. Mim’s blog is also available here: https://datamonkeysite.com/, and the raw data source is http://nemlog.com.au/nemlog/
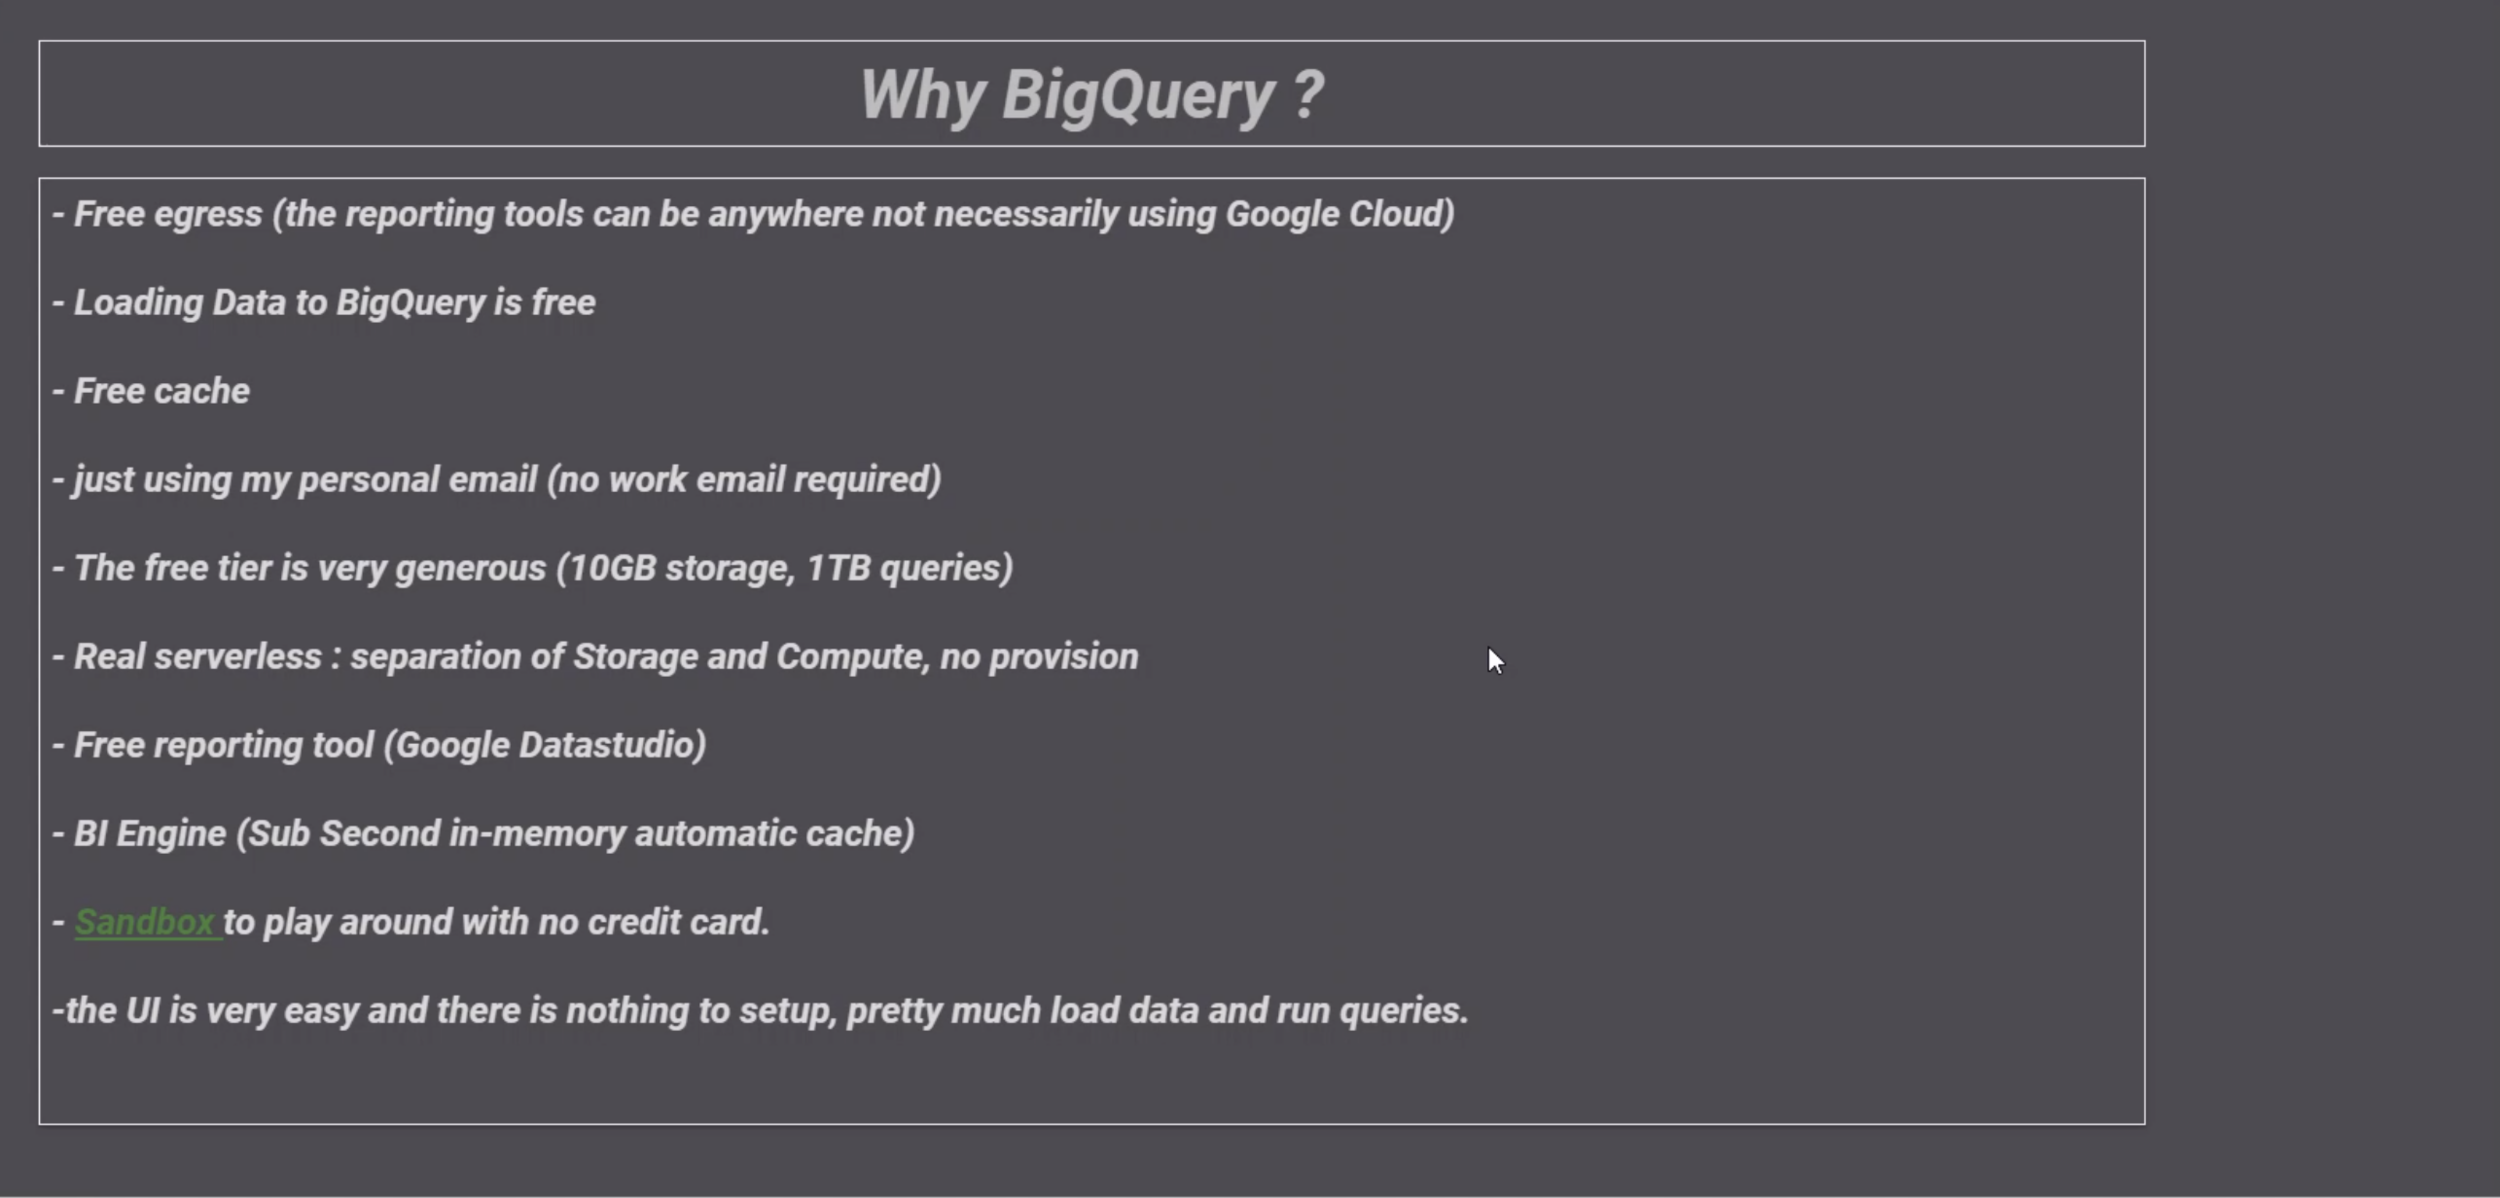
Additionally he described the pros and cons behind different tools used in the workflow for extracting, processing and visualising the data!




Do you want to learn how to design engaging and intuitive Power BI reports, which communicate your key insights at a glance and tell your data story?
Our two-day Power BI training course is designed specifically for Power BI Professionals and Data Analysts, and provides our best practice tips, tricks and hacks to help you transform your data! We provide this course online, in-person group sessions, or customised in-house training for your team. Places are limited (max 8 participants per class) so secure your spot today!