
Exploring the DCCEEW Flood Recovery Power BI Dashboard
The "Power BI and Data Analytics for Enviros" meetup group is all about sharing tips, tricks and hacks for analysing, visualising and communicating environmental data. The purpose of this blog is to summarise the key take-aways from the sessions, to help with sharing knowledge, empowering others and creating a strong data culture across our community.
August 2024: Session summary
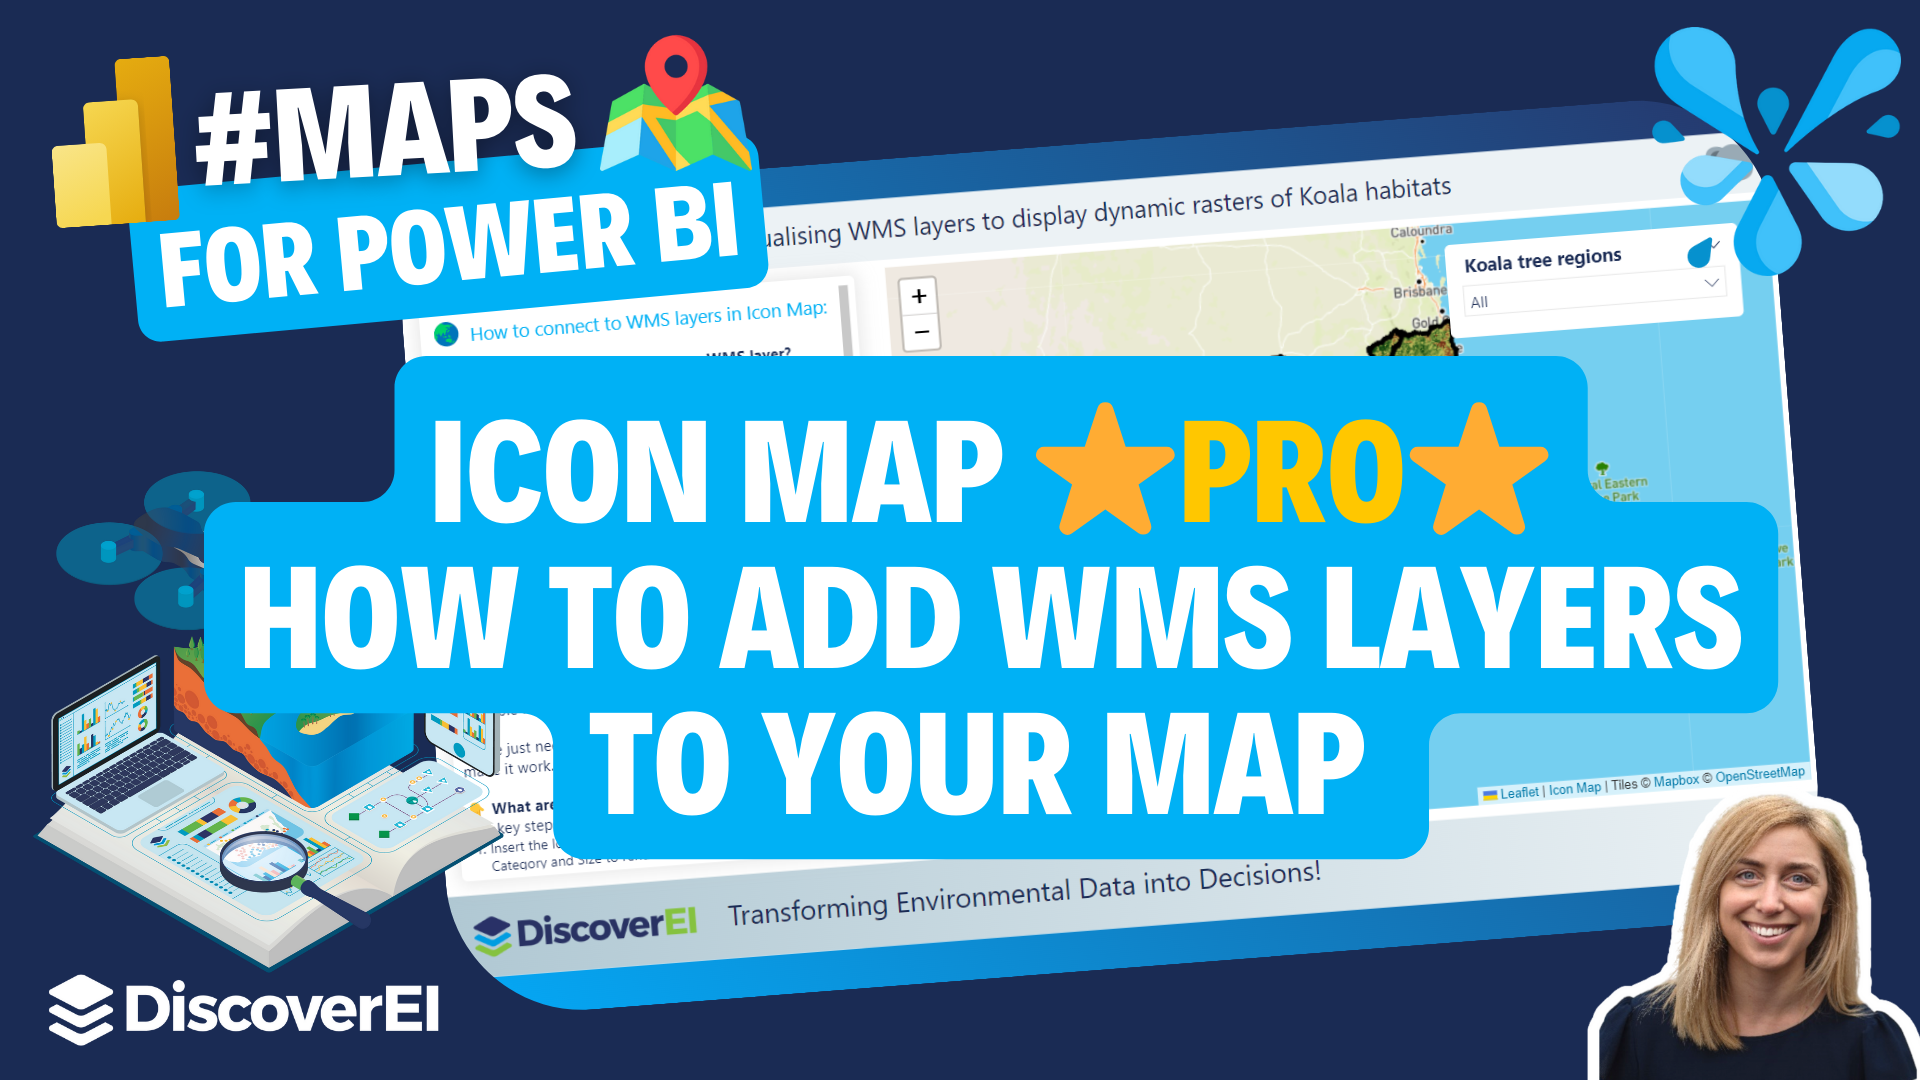
In this session, Alice & Christian from DiscoverEI deep-dived into exploring the recently completed DCCEEW (NSW State Government) Flood Recovery Power BI Dashboard. It is a public dashboard available via the EPA NSW website: https://www.epa.nsw.gov.au/reporting-and-incidents/flood-recovery-programs/water-quality-monitoring-program/flood-recovery-program-east-coast-dashboard.
The session focused on explaining the context behind the tool, then identifying several Power BI techniques adopted to allow for the dynamic user interface. This included Power Query steps, the data model creation, DAX calcs and various visuals including the more advanced Icon Map features. We hope you learn more about Power BI's functionality from viewing this video

🎦 Check out the full event recording here 🎦
Our Speakers:
Alice Drummond: With 10 years’ experience working as a Water Resources engineer in environmental consulting, and 5 years’ experience working as an environmental analyst, Alice has a deep understanding of how data can be used to provide insights, drive efficiencies, and improve stakeholder engagement. As a Microsoft Most Valuable Professional (MVP) for the Data Platform, Alice combines her knowledge of water resource management, data analytics and computer programming to deliver high-quality data solutions for her clients, with a specific focus on leveraging Power BI.
Christian Borovac: Christian is an environmental engineer, data analyst and visualisations consultant, along with co-founder of DiscoverEI. He focuses on creating Power BI reports, with design in mind to help visualise and communicate environmental systems to develop a greater understanding of the complex environmental issues we are trying to solve. He has over 10 years’ experience working as an environmental engineer in environmental consulting, and over 5 years working in data analytics. He is also an avid Fremantle Dockers AFL fan, and enjoying their successful 2024 season so far!
Sign up now for the meetup here: https://www.meetup.com/en-AU/powerbi4enviros - and if you have ideas for a future session then please let us know at info@discoverei.com .

Power BI Training Courses
If you’re interested in learning from our team, then we have a range of 2-day Power BI training courses available to fast-track your Power BI journey.
Click on the links below to learn more, and get in touch with the team today!
Purchase Training


Do you want to learn how to design engaging and intuitive Power BI reports, which communicate your key insights at a glance and tell your data story?
Our two-day Power BI training course is designed specifically for Power BI Professionals and Data Analysts, and provides our best practice tips, tricks and hacks to help you transform your data! We provide this course online, in-person group sessions, or customised in-house training for your team. Places are limited (max 8 participants per class) so secure your spot today!