
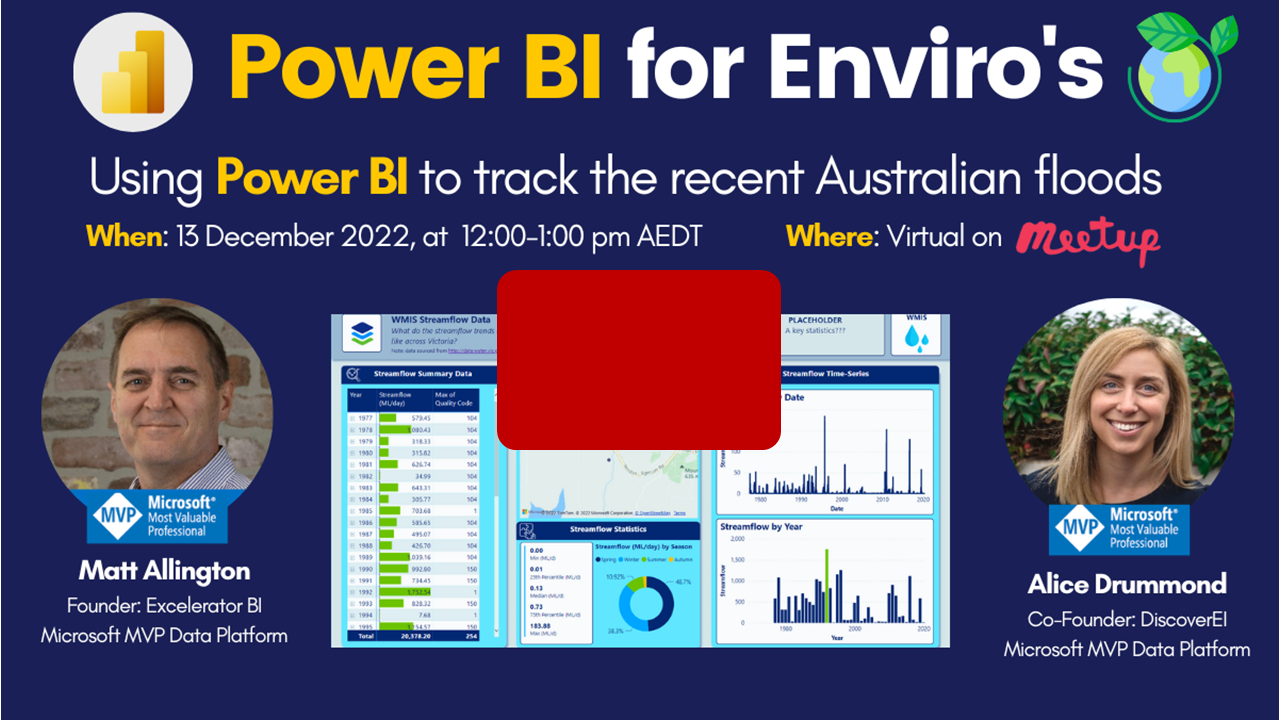
Using Power BI to track the recent floods across eastern Australia
The "Power BI and Data Analytics for Enviros" meetup group is all about sharing tips, tricks and hacks for analysing, visualising and communicating environmental data. The purpose of this blog is to summarise the key take-aways from the sessions, to help with sharing knowledge, empowering others and creating a strong data culture across our community.
🎦 Check out the full event recording here 🎦
Session Summary
For our December 2022 session, we were joined by Matt Allington (Microsoft MVP Data Platform - Sydney, Australia) who shared his Power BI report presenting streamflow data from the most recent October floods that impacted much of Australia. Matt discussed several elements of the study and Power BI report, including:
How the data was accessed and loaded into Power BI;
How the data was used;
Some challenges along the way;
Some of the tricks used to present the key insights from the study!
Matt has been posting daily updates about impacts to the Big Bend region through his YouTube channel, which you can refer to here: Excelerator BI YouTube
Our thoughts remain with anyone that has been or is being impacted by these devastating floods, especially those within our meetup community❤️ !
Sign up now for the meetup here: https://www.meetup.com/en-AU/powerbi4enviros - and if you have ideas for a future session then please let us know at info@discoverei.com .

Power BI Training Courses
If you’re interested in learning from our team, then we have a range of 2-day Power BI training courses available to fast-track your Power BI journey.
Click on the links below to learn more, and get in touch with the team today!
Purchase Training


Do you want to learn how to design engaging and intuitive Power BI reports, which communicate your key insights at a glance and tell your data story?
Our two-day Power BI training course is designed specifically for Power BI Professionals and Data Analysts, and provides our best practice tips, tricks and hacks to help you transform your data! We provide this course online, in-person group sessions, or customised in-house training for your team. Places are limited (max 8 participants per class) so secure your spot today!