
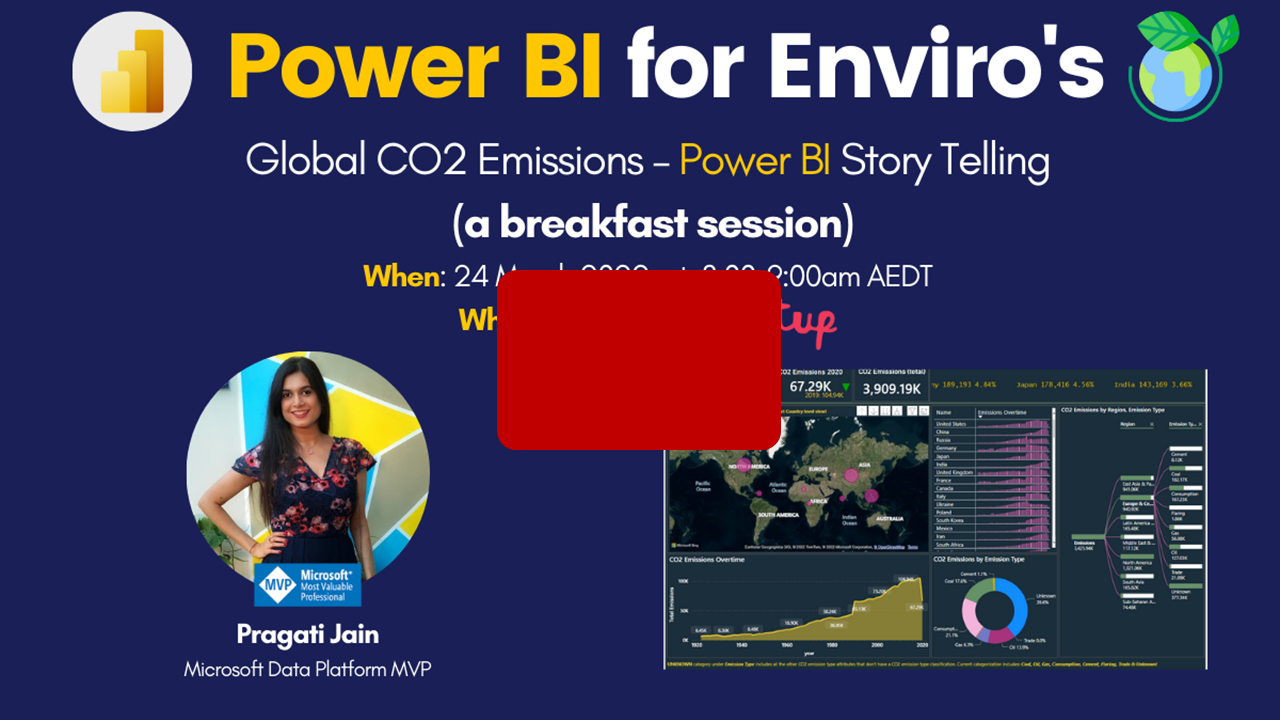
Global CO2 Emissions: Power BI Story Telling with Pragati Jain
The "Power BI and Data Analytics for Enviros" meetup group is all about sharing tips, tricks and hacks for analysing, visualising and communicating environmental data. The purpose of this blog is to summarise the key take-aways from the sessions, to help with sharing knowledge, empowering others and creating a strong data culture across our community.
🎦 Check out the full event recording here 🎦
Session Summary
In this session, Pragati took us through her Global CO2 Emissions Power BI report, to share what insights can be derived from this data. Her version of the report for your interest is available here: https://community.powerbi.com/t5/Data-Stories-Gallery/Global-CO2-Emissions-Analysis/td-p/2313590
The session included the following:
Going through the underlying publicly available dataset and try to understand a few data points that can help in giving quick insights;
Create few elements of the report that can strongly give evidence of what’s happening with CO2 Emissions;
Summarising & visualising data at the relevant granularities to get top insights;
Showcasing a ready Power BI report where the following was discussed:
Why particular visuals were used to represent the information?
Why shown granularities were used to analyse & visualise the data?
What thought process the developer had behind creating this report?
What additionally can be included in the report to get add-on insights out of data?


About Pragati Jain:
Pragati has been recently awarded with Microsoft Most Valuable Professional award (MVP) under Data Platform category. Currently, she is working as a Senior Consultant at Avanade in UK and works towards generating and delivering data insights to various customers. She holds a Master’s degree in Data Science and Analytics from Royal Holloway University of London.
She is skilled in various tools and technologies like Microsoft Power BI, Tableau, Microsoft Excel, Azure ML Studio, Azure Databricks Pyspark and SQL. She has been using Power BI for few years now and started participating on Power BI Community from last few months where she is one of the community Superusers.
Outside work she enjoys photography, loves hiking, she is a trained Indian classical singer and has a passion for painting. She even has her Instagram page dedicated to painting.
Blog - https://datavibe.co.uk
LinkedIn: https://www.linkedin.com/in/pragatijain1187/
Twitter - https://twitter.com/pragati1187
Instagram: https://www.instagram.com/creationsbyprags
Microsoft MVP: https://mvp.microsoft.com/en-us/PublicProfile/5004163?fullName=Pragati%20Jain
Microsoft Power BI Community: https://community.powerbi.com/t5/user/viewprofilepage/user-id/81077
Sign up now for the meetup where we continue to announce new sessions into 2022: https://www.meetup.com/en-AU/powerbi4enviros - and if you have ideas for a future session then please let us know at info@discoverei.com .

Power BI Training Courses
If you’re interested in learning from our team, then we have a range of 2-day Power BI training courses available to fast-track your Power BI journey.
Click on the links below to learn more, and get in touch with the team today!
Purchase Training


Do you want to learn how to design engaging and intuitive Power BI reports, which communicate your key insights at a glance and tell your data story?
Our two-day Power BI training course is designed specifically for Power BI Professionals and Data Analysts, and provides our best practice tips, tricks and hacks to help you transform your data! We provide this course online, in-person group sessions, or customised in-house training for your team. Places are limited (max 8 participants per class) so secure your spot today!