

Discover our Latest Projects!
DCCEEW Biodiversity Indicator Program Power BI Report
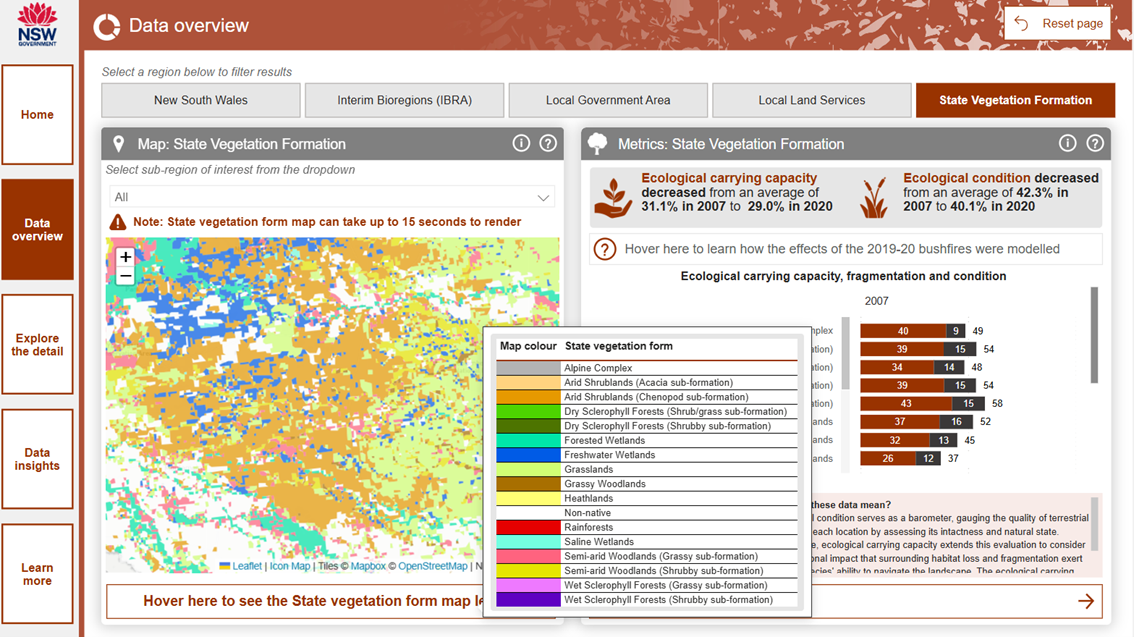
DiscoverEI worked collaboratively with the NSW Department of Climate Change, Energy, the Environment and Water (DCCEEW) to create a Biodiversity Indicator Program (BIP) Power BI report. This report visualises data on the state and trends of biodiversity and ecological integrity according to several derived indicators, and applies this for key identified areas across the state. This solution is being publicly hosted on the SEED hub with access to the report and more information provided in the following buttons.
Blue Mountains City Council Waterway Health Explorer
Flood Recovery Dashboard


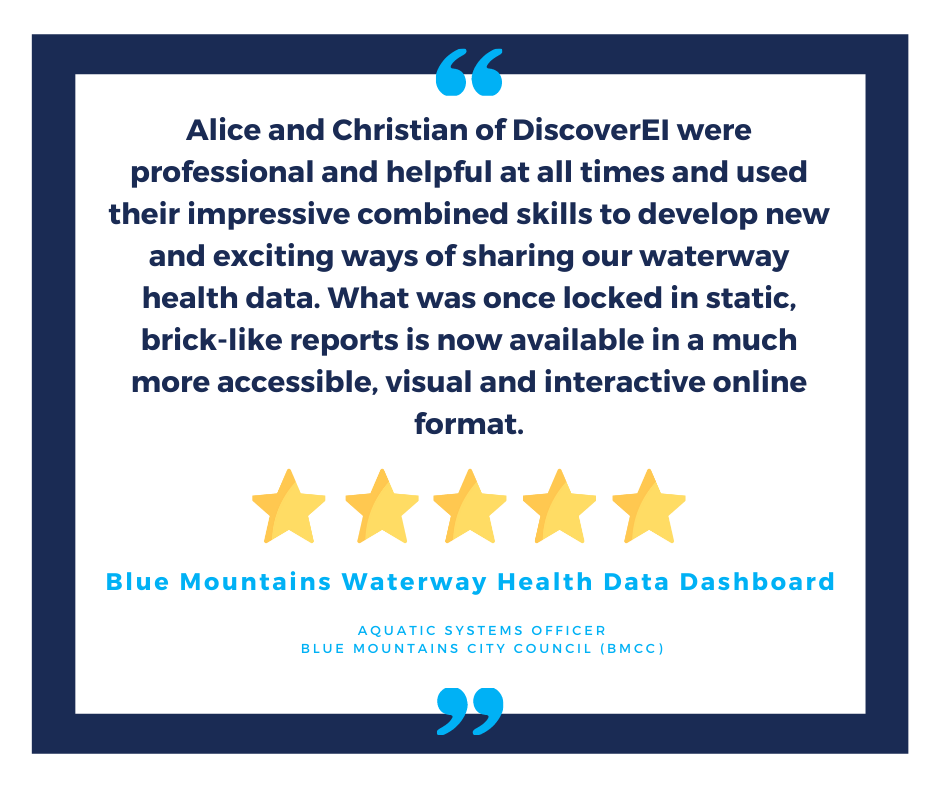
DiscoverEI worked with BMCC to develop a Power BI report to visualise several datasets across their waterway systems. Power BI was used as the interface for communicating data to both internal and external stakeholders on the health of their catchments and systems, including ecological and recreational water quality, waterbugs and freshwater crayfish. It also communicated steps BMCC were taking to manage and protect their creeks and the environmental values associated with these.
DiscoverEI worked collaboratively with the NSW Department of Planning and Environment and the NSW EPA to create a public-facing online interactive Power BI dashboard for the ‘Flood Recovery Program for Water Quality Monitoring - East Coast Project’ study. The purpose of the dashboard is to assist the community in understanding the extent and duration of flood impacts on water quality and help inform decision making around waterway use following flood events.
Mid Murray Flows Interactive Web Map

DiscoverEI worked collaboratively with Charles Sturt University (CSU) to develop a customised interactive online visualisation tool to help communicate river and environmental flow data, and fish survey results across the Edward/Kolety-Wakool River system in southern New South Wales. We developed the tool using custom scripting and packaged into a WordPress plugin on the publicly available on the FLOW-Monitoring, evaluation and research (MER) website.
Great Barrier Reef SELTMP Dashboards

DiscoverEI developed two interactive dashboards in Power BI to communicate the findings of the Social and Economic Long-Term Monitoring Program (SELTMP) to support managers and decision-makers within the Great Barrier Reef region to improve planning and management for the Reef’s future. The dashboard brings together data about Reef users, communities, and industries, enabling new insights into their dependencies and relationship with the Reef, and how this is changing over time.
Water for Life Dashboard
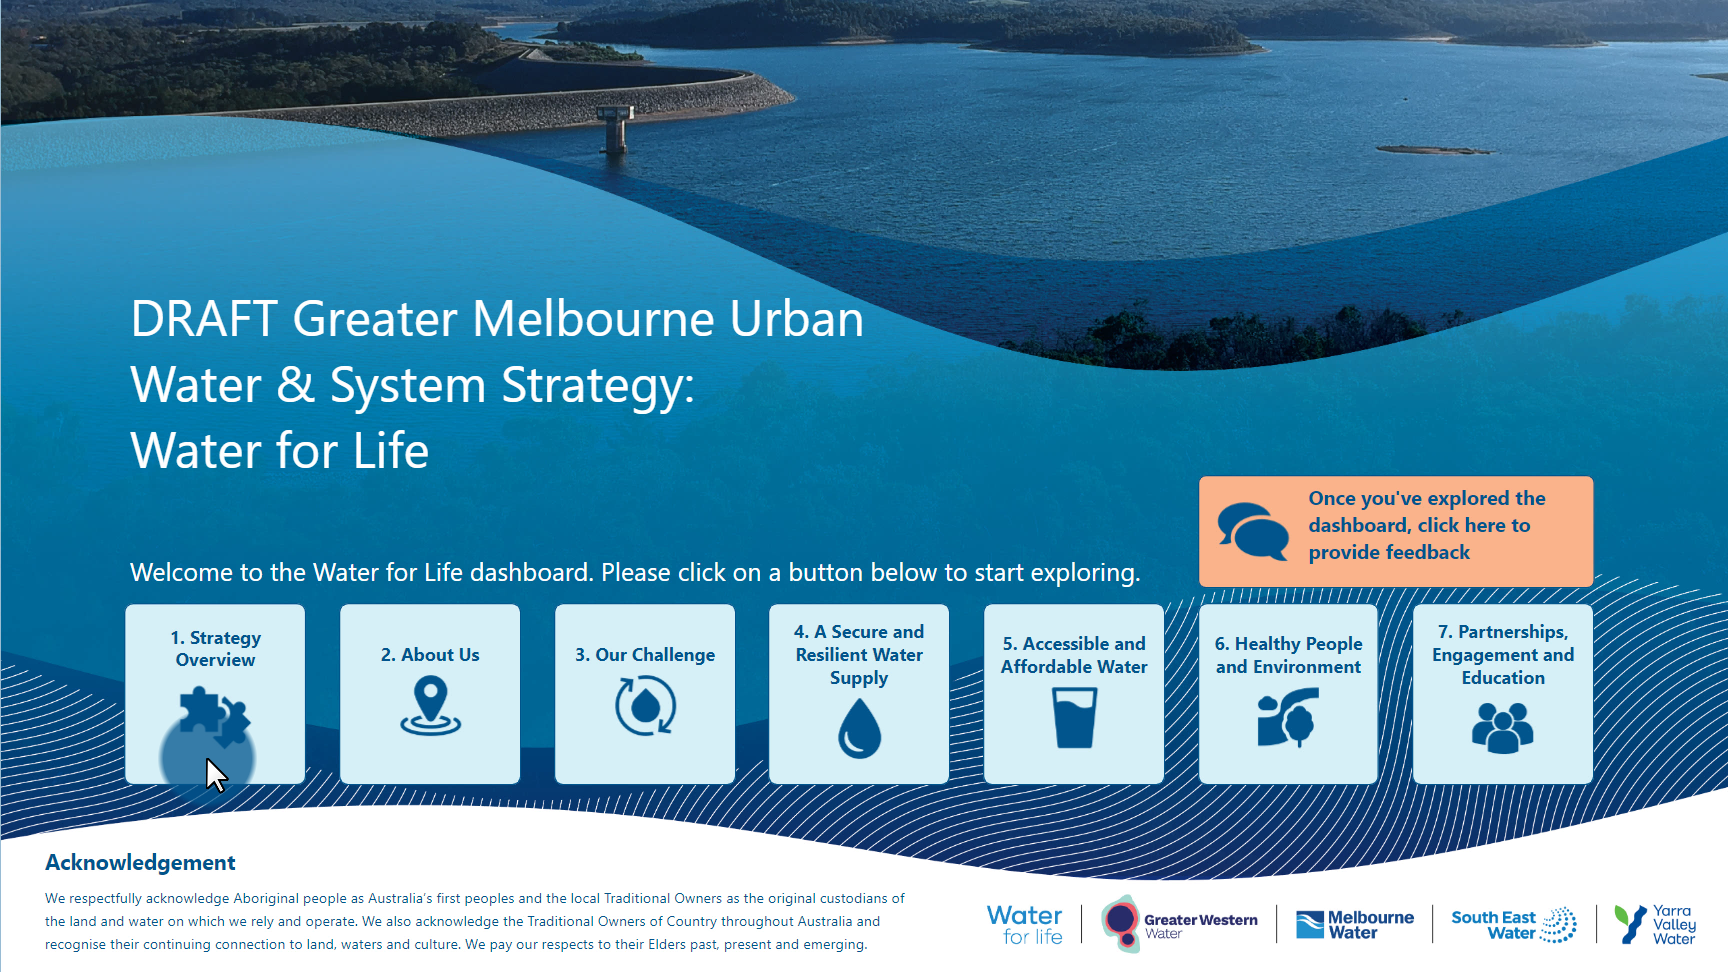
DiscoverEI is proud to have worked together with the Greater Melbourne Water Corporations to create the Water for Life Strategy Dashboard, to help communicate their strategy to secure the water supply of Melburnian’s for the next 50 years. Through combining videos, interactive maps, infographics and dynamic narratives the we have unlocked the data to quickly create a shared understanding of the strategy for both technical and non-technical audiences.
Urban Water Strategy Dashboard
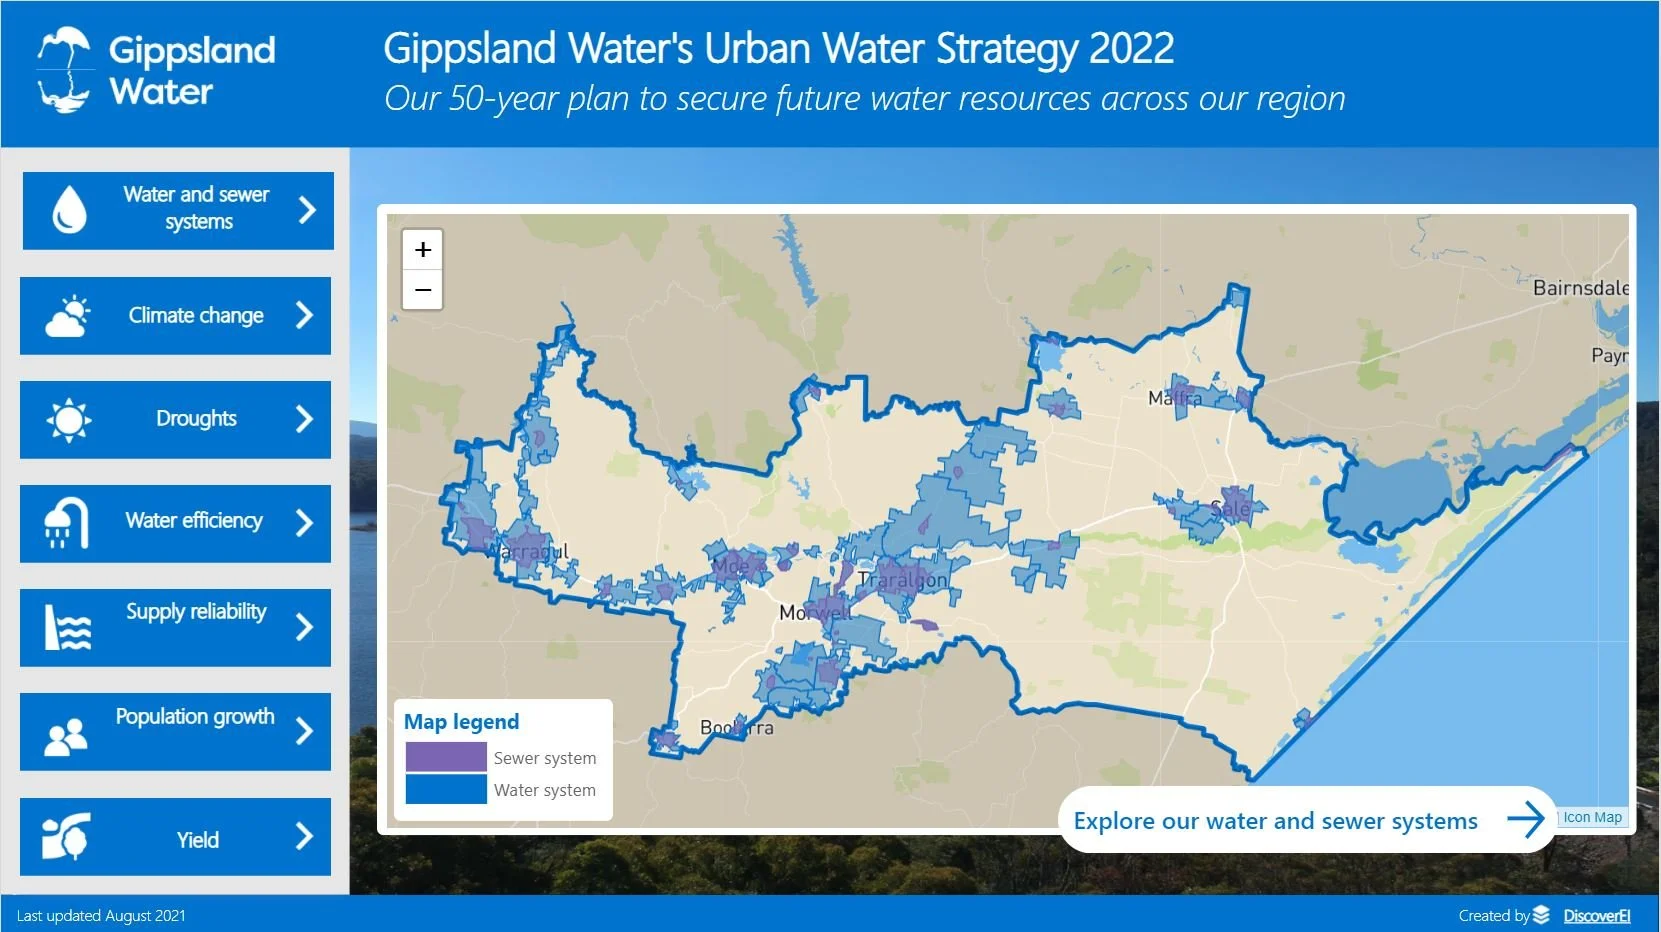
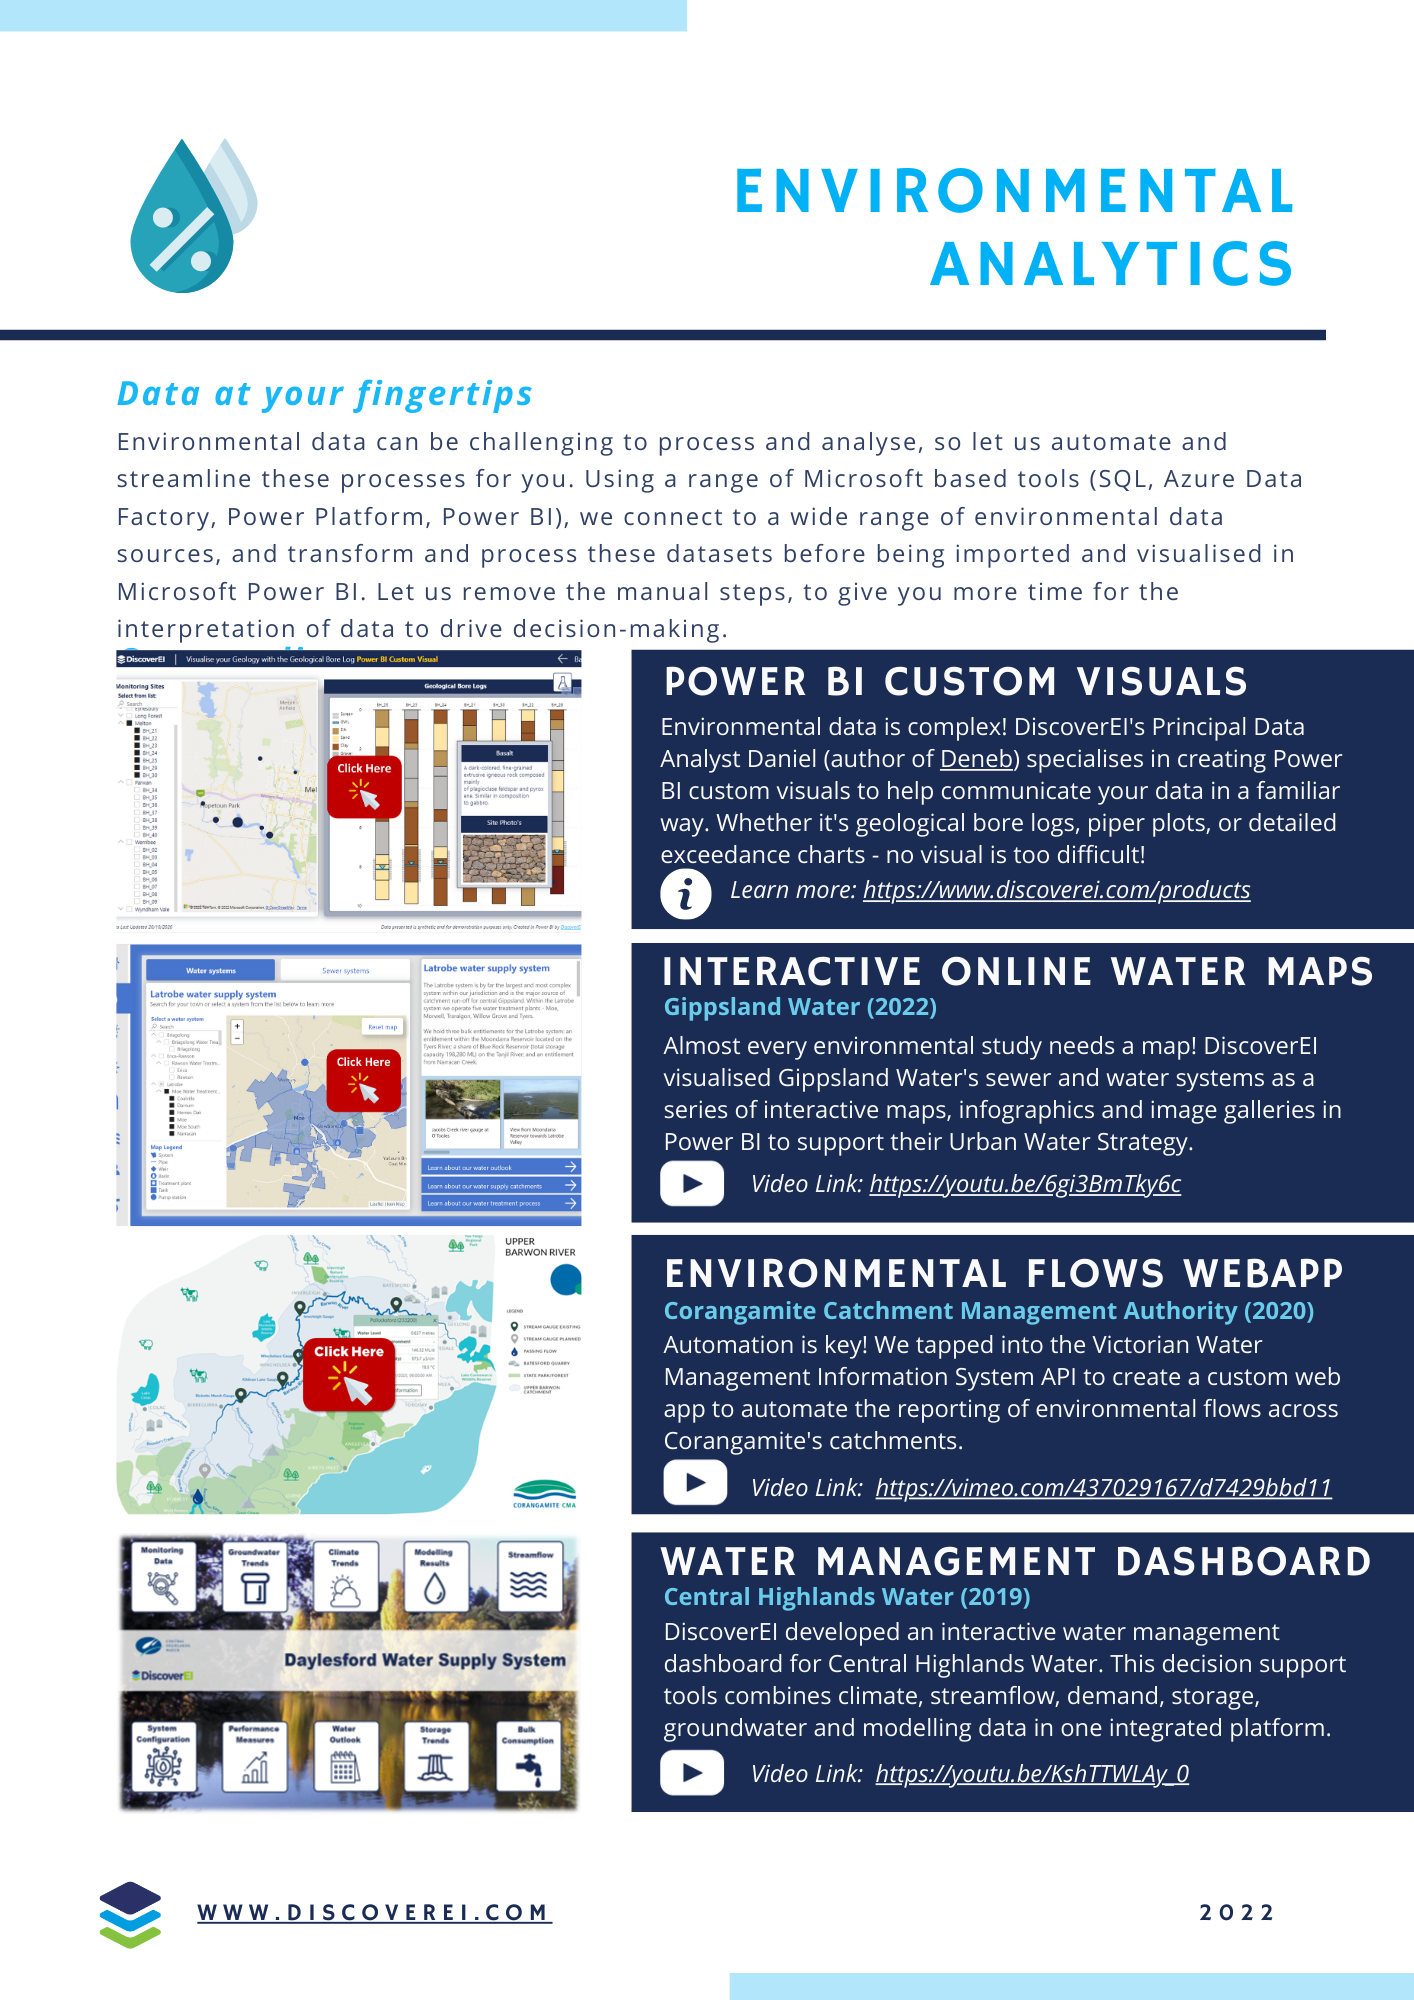
DiscoverEI is proud to have worked collaboratively with Gippsland Water to develop an interactive dashboard to help communicate the Gippsland Water Urban Water Strategy – their 50 year plan to secure future water resources across the region. Click on the link below to explore the dashboard, including the interactive water and sewer maps, interactive infographics and photo galleries to learn more about where water comes from and where it goes across the Gippsland region.
DELWP Vic Water Grid

The DiscoverEI team is proud to have supported the DELWP Grid Oversight team, in developing their Biennial Statement for the Vic Water Grid. This website features a series of embedded Power BI reports that help describe what is “the grid”, and allows users to see how DELWP are preparing for a future with less water by getting the most out of the grid. The interactive dashboards can be accessed through the button below.
COVID-19 Water Security Risk Index Dashboard
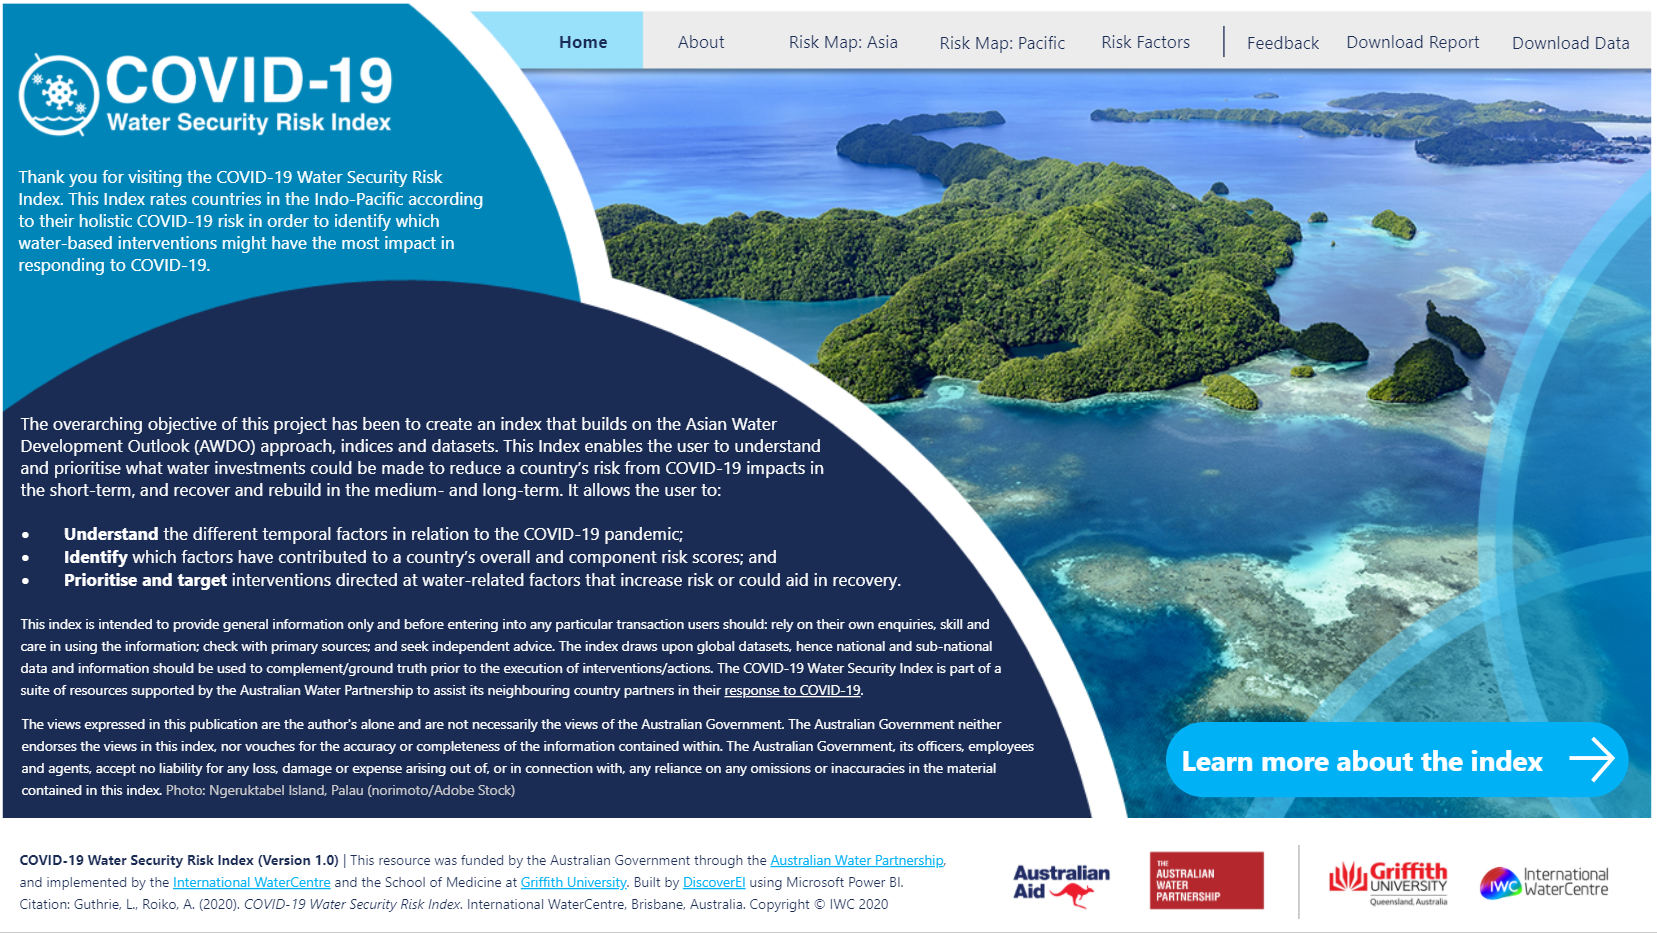
The DiscoverEI team was proud to have worked alongside Griffith University, the International WaterCentre and the Australian Water Partnership, to develop this COVID-19 Water Security Risk Index Power BI report. This interactive decision support tool is enabling governments, communities and development organisations, to visualise the risks to water security, and prioritise response to assist those countries across the Indo-Pacific.
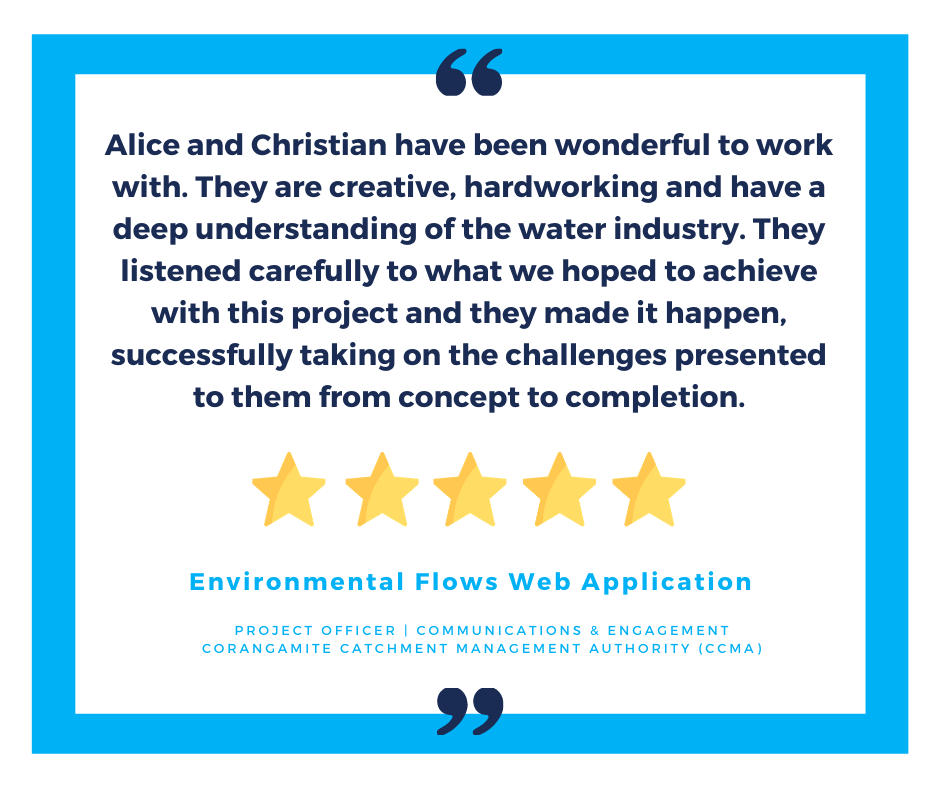
Environmental Flows Webtool

The DiscoverEI team developed a custom web application to visualise environmental and river flows across several catchments. By developing the tool in JavaScript we were able to customise the look and feel of the tool, and integrate environmental data from the Victorian Water Management Information System (WMIS) with local ‘on-premise’ data sources to provide near real-time reporting. The tool can be accessed through the button below.
Our capability statement contains further details on our previous projects, services and training options, so take a look and get in touch today (info@discoverei.com) if you want to learn more!!

Discover our Custom Visuals
We have been working to develop a range of Power BI custom visuals tailored for the environmental industry. We have the DiscoverEI Geological Borelog and Marginal Cost Curve (MCC) currently available for purchase in our Marketplace. The perfect customised visuals for presenting your niche environmental data!
Products

DiscoverEI Video Blogs!
The intersection of Power BI, Design and the Environment
Check out our video blog and YouTube channel for our latest video tutorials where we share our favourite tips and tricks on all things Data Analytics and Graphic Design from across the environmental industry.
Latest Video Blog Tutorials


Power BI Training
Learn how to transform data into decisions in our Power BI Masterclass training programs

From data storytelling, to dashboard design and environmental science - we’ve got your Power BI training covered! Get in touch today with our team of Microsoft Certified Trainers to secure your place!


Power BI for the Water Industry
from A$999.00

Power BI for Environmental Professionals
from A$999.00
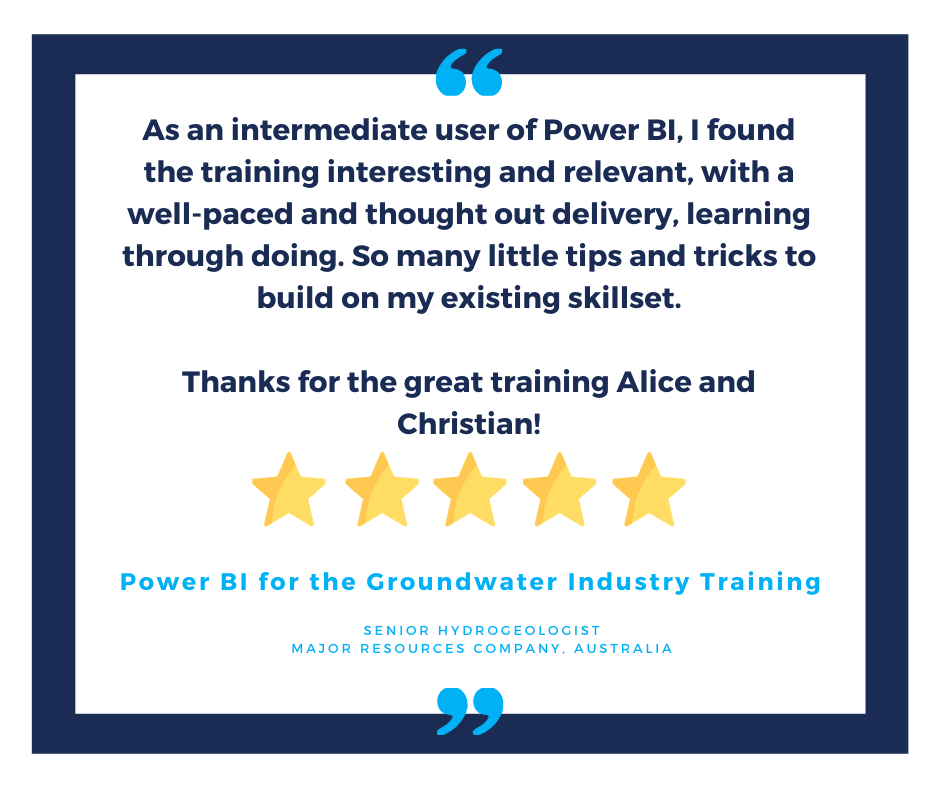
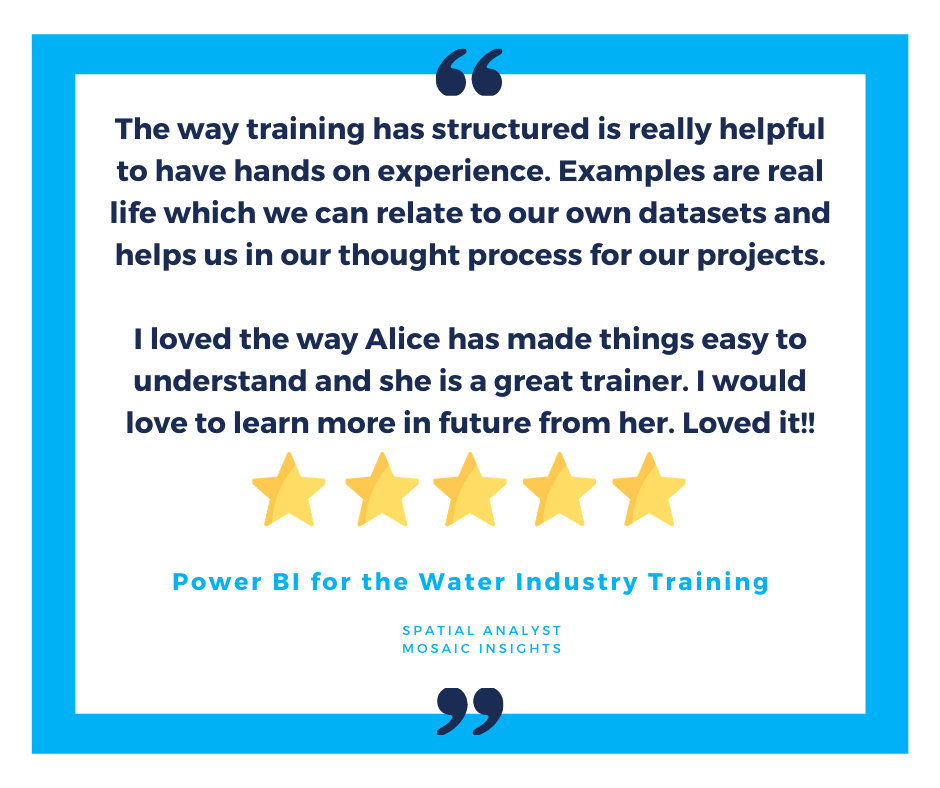
Feedback from our participants…


Take a look at some of the interactive dashboards you’ll create from scratch!
Click on the images below to interact with the Power BI reports…
DiscoverEI Presents…
Come along to our events and online monthly meetups

Join Our Meetup: Power BI for Enviro’s
The DiscoverEI team are excited to have started up our own Meetup group, all around bringing together other people in the community who are as passionate about data analytics and the environment as we are! This Meetup is a place for sharing tips, tricks and hacks for analysing, visualising and communicating environmental data. Our mission is to empower everyone to use data effectively to better manage our environment!

Our Solutions
Data Analytics, Design and Environmental Engineering
Data Analytics

Data at your fingertips
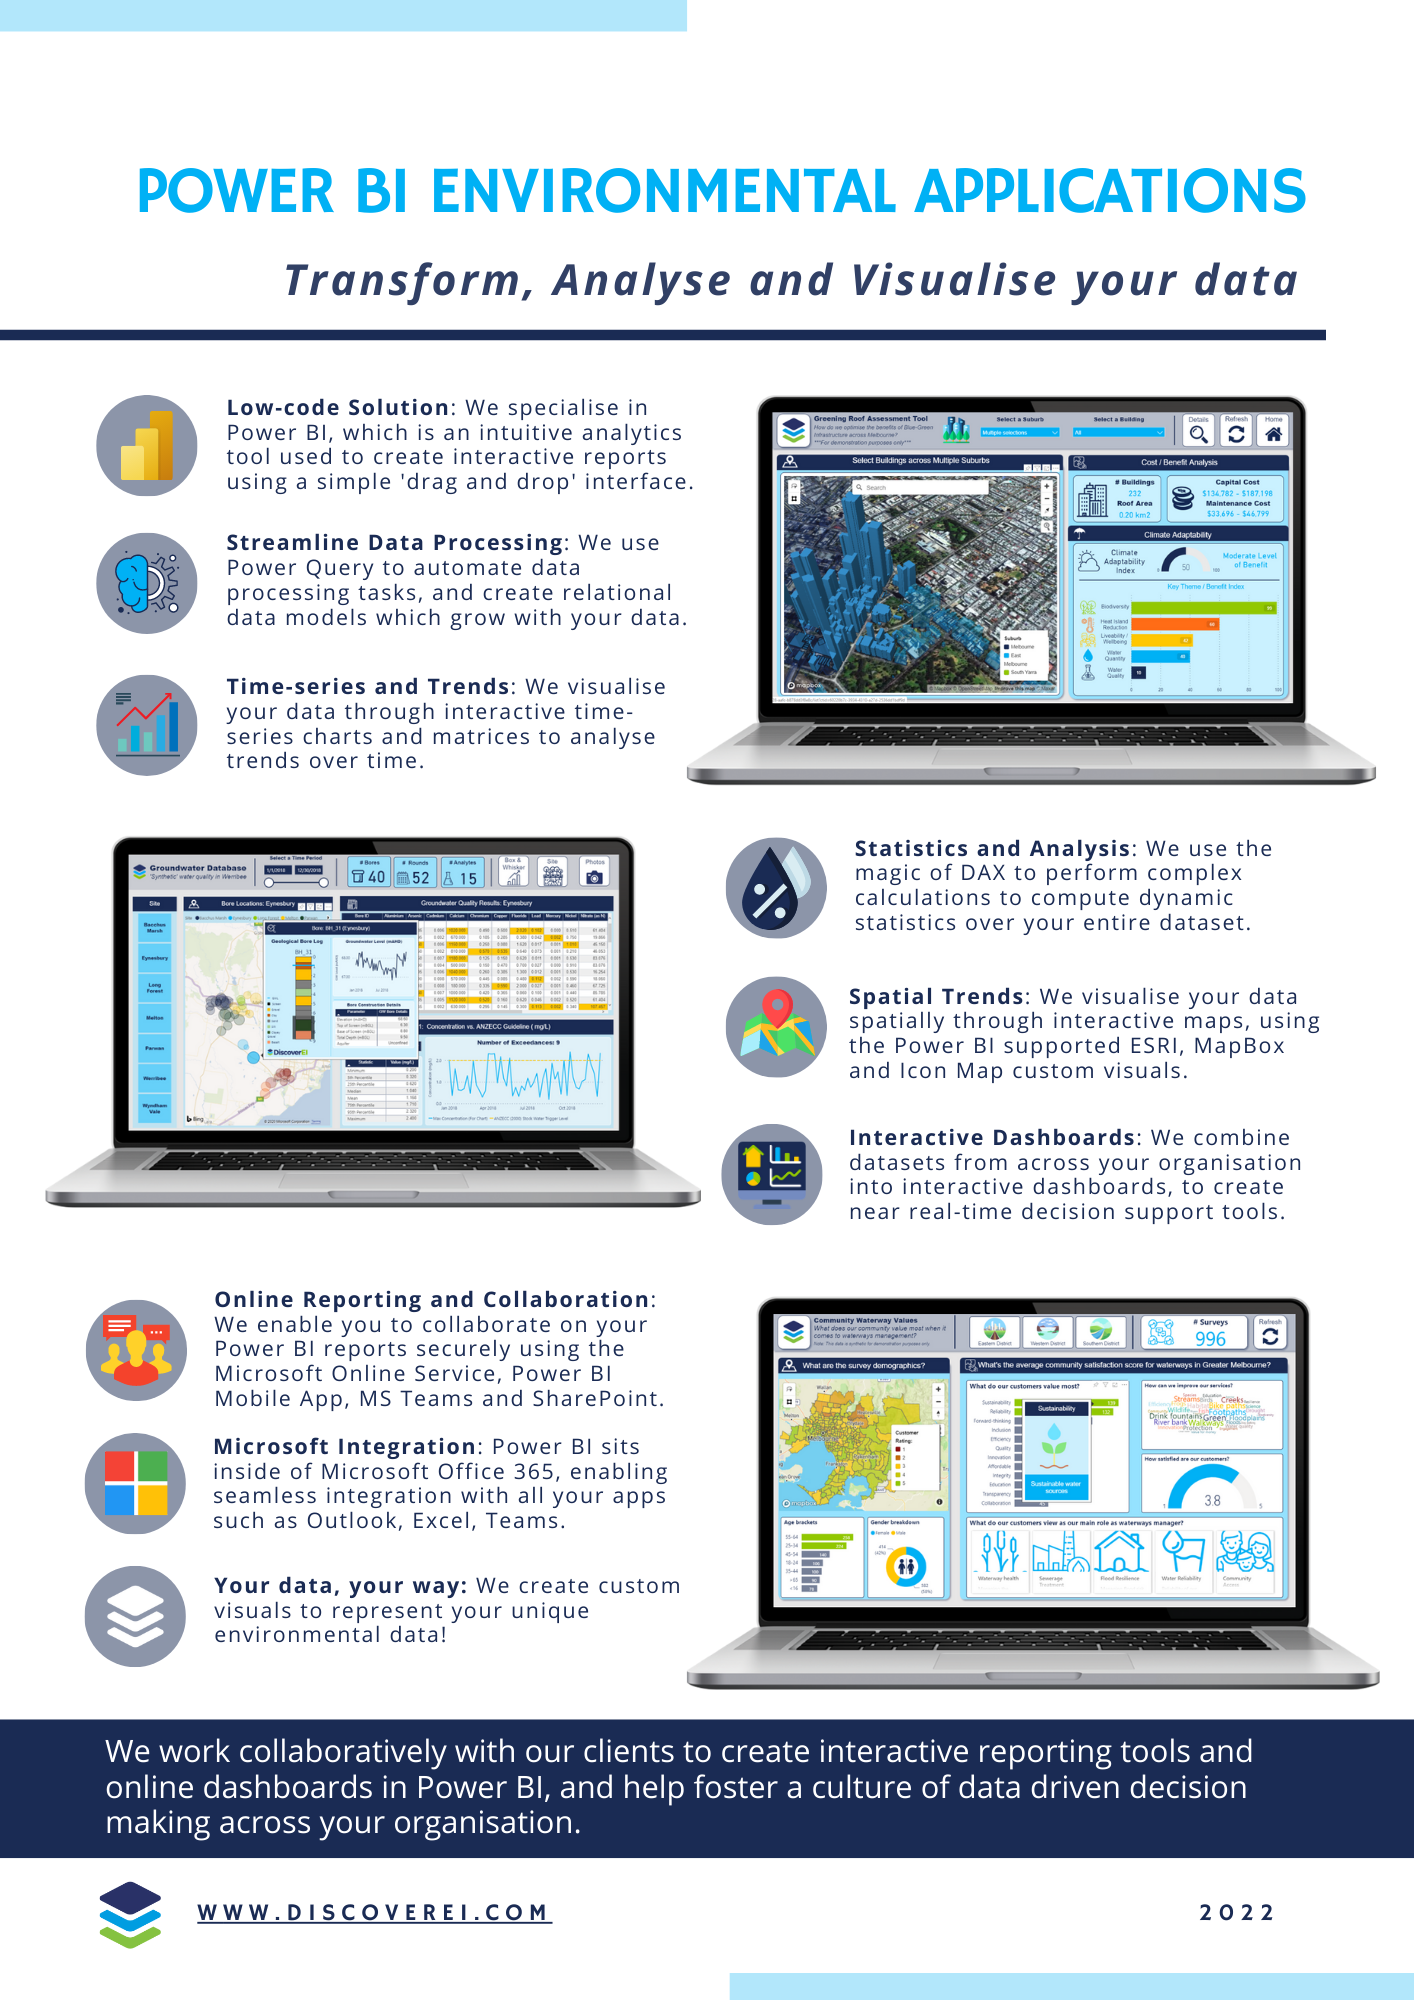
Applying the latest Business Intelligence tools within the environmental industry, we process, analyse and visualise your data through interactive dashboards and mobile apps to discover your data story. Our expertise includes: database and dashboard development (Power BI), custom visual development, mobile apps, and in-house training.
Graphic Design

See the big picture
Using video footage and computer animations, we enable you to better understand, visualise and communicate complex systems, and bring your environmental data to life. Our expertise includes: video capture by drones, environmental schematics, computer animations as well as developing virtual and mixed reality solutions.
Environmental Modelling

From simulations to solutions
We conceptualise, configure and simulate models of groundwater and surface water systems, working with you to develop solutions for your environmental challenges. Our expertise includes: water allocation modelling (eWater Source, REALM), groundwater modelling (MODFLOW, PEST), and environmental site assessments.
What our clients are saying…


In the Spotlight
The DiscoverEI team sharing their stories!

Congratulations MVPs!
The DiscoverEI team are incredibly proud to celebrate Alice Drummond and Daniel Marsh-Patrick for both being recognised as Microsoft Data Platform MVPs!

But what exactly is an MVP..?
Microsoft Most Valuable Professionals, or MVPs, are technology experts who passionately share their knowledge with the community. They have a very deep knowledge of Microsoft products and services, while also being able to bring together diverse platforms, products and solutions, to solve real world problems, and are driven by their passion, community spirit, and quest for knowledge! Above all and in addition to their amazing technical abilities, MVPs are always willing to help others - that's what sets them apart!
For Alice, it’s her passion for Power BI and the environment, where she is constantly sharing new and interesting examples of how we can bring environmental data to life, inspiring the community through the DiscoverEI blog, YouTube channel, Data Stories Gallery, PowerBI.Tips contributions and as many conference and community events she can attend!!! She’s also incredibly passionate about #WomenInTech and is a community leader for the Women in BizApps Melbourne Meetup.
For Daniel, it’s sharing his intimate knowledge of the Microsoft stack, consistently posting helpful content and answering the Power BI community questions across all forums, which has also earned him the esteemed title of Datanaut! Daniel is also pushing the boundaries of open source custom visual development (check out his AWESOME Violin Plot and Small Multiple Line Chart) and regularly shares his learnings and experiences through many conference presentations, community events and his Coacervo blog!
The DiscoverEI Data Gods

The DiscoverEI Co-Founders Alice and Christian have been inducted into the KratosBI Data God Hall of Fame, for their amazing work combining graphic design and Power BI to bring environmental data to life!
Chris Wagner (aka. King of the Data Gods) works tirelessly to empower the global Power BI community to work together to create, share and promote amazing content to make the most out of Power BI. Head across to KratosBI.com to find loads of great content to help you get started with your Power BI journey!

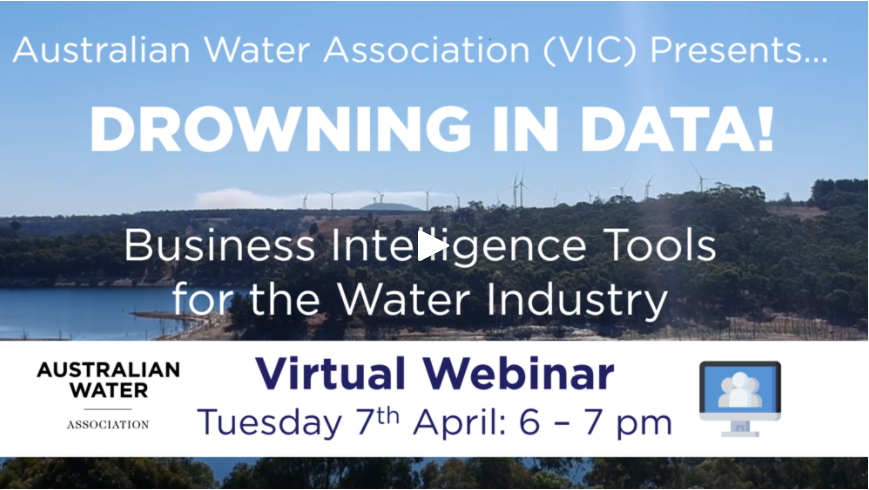
Australian Water Association
Drowning in Data: Business Intelligence Tools for the Water Industry
In this age of ‘Big Data’ and real time monitoring, our water industry is literally drowning in data. As water professionals, we are constantly challenged to transform data into decisions.
Join Alice Drummond (DiscoverEI) alongside Jacqui Kelly (Wannon Water) and Amanda Hazell (Melbourne Water) where we share how we are using Business Intelligence tools to support a culture of data driven decision making across the water industry.
From Canvas to Creation
We had a fantastic time presenting virtually at the Portland PUG, sharing design tips for taking your reports from Canvas to Creation! The Portland PUG is an awesome community and Greg P and Bastian are fantastic hosts who bring amazing speakers in from all across the world.
Data is more than just numbers on a page - when combined with design, we suddenly have the power to connect and engage with our report users and ultimately transform our data into decisions. In this session we went through practical design tips to help you start shaping your data story in Power BI - quickly! Its important to always ask questions of your data, and get something on the page early with a '5-minute mock-up'. From here you can quickly transform a 'Proof of Concept' report, into a work of art with layouts, themes, corporate branding, which help get early feedback and engagement from business report users. We demo how to add some finishing touches like navigation bookmarks, buttons and tooltips to create a seamless user experience.
Click on the button below to register for the awesome meetup group!
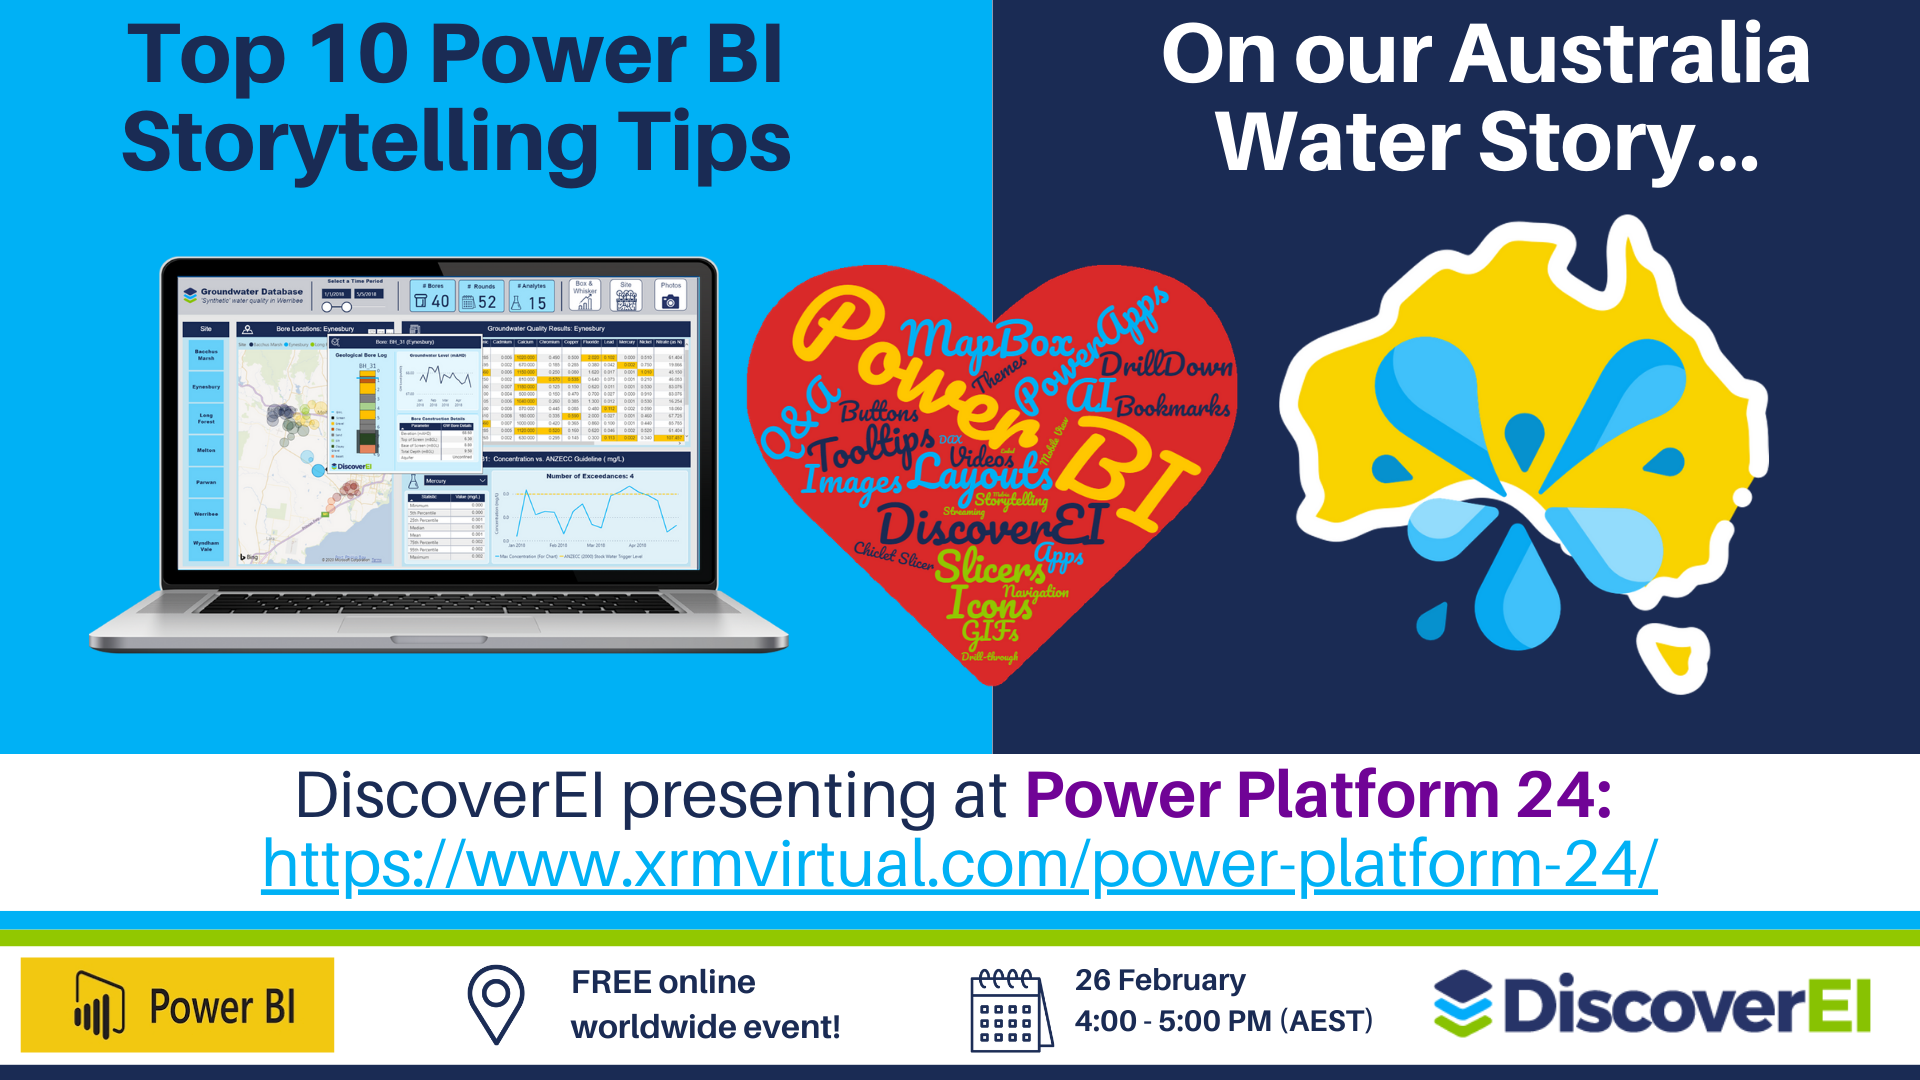
The Power of Storytelling
As data analysts, we are constantly challenged to think harder about how we can turn mountains of data into business actions. Alice and Christian gave an interactive, demo heavy session sharing their Top 10 Power BI Storytelling Tips from a range of case studies across the water industry as part of the Power Platform 24 virtual conference!
Watch the full recording from their session (and many more awesome sessions!!) to learn how to use bookmarks for seamless navigation; layouts to frame your reports; embed videos and GIFs to create emotional connections; use cross-report drill-through to create linkages; configure decomposition trees to facilitate decision making; and many many more tips to help you share your data story! And stay tuned, because this has the makings of a great blog series…
ABC Radio: Water Management
Alice Drummond, Director of Environmental Analytics at DiscoverEI, sat down with Antony Funnell from ABC Radio National, to offer her perspective on how we can apply data analytics tools to help manage Australia’s precious water resources. This interview is part of the ABC series on water conflict and management – the politics, the problems and the potential solutions.
Panel Guests:
Alice Drummond – Director of Environmental Analytics for the environment intelligence consultancy DiscoverEI
Dr Stuart Blanch – Senior manager, land clearing and restoration, WWF Australian
Dr Belinda Wade – Co-lead, business sustainability research area, University of Queensland Business School
Dr Andrew Ross - Research Fellow, Australian National University and the National Centre for Groundwater Research and Training
Dr Scott Moore – Director, Penn Global China Program; Senior Fellow, Kleinman Center for Energy Policy and also the Water Center, University of Pennsylvania
Dr Mark Cuthbert - Lecturer in Groundwater Sciences, Cardiff University
YBF Tech Start-Up Spotlight

Working out of YBF Ventures, Australia's top startup hub for tech and innovation, we’re constantly surrounded by others who are on a similar journey to discovering how we can develop, and apply technology to help make our world a better place.
It was wonderful to reflect on the DiscoverEI journey with Joe Harrington (YBF Ventures), and share a bit more about how we are applying data analytics and visualsiation tools to streamline environmental modelling and create a shared understanding of the complex environmental systems we are working to protect. Can’t wait to reflect again in another 12 months!
DiscoverEI Channel
Check out our YouTube channel today for Case Studies and Video Tutorials!

Data Analytics for Environmental Challenges
Protecting our environment is not just about collecting and analysing data. It’s also about educating and engaging our communities, and using all of the tools at our disposal to help secure a more sustainable environment for future generations.
Take a look at our case studies to see how DiscoverEI combine the Power BI, PowerApps and Power Automate to help transform environmental data into decisions. We created this short video to help spark ideas for the #Hack4Good event happening at the Microsoft Community Summit in Barcelona in March 2020, where teams are working together to solve some of our biggest environmental challenges using the Microsoft stack! The datasets presented in this video are for demonstration purposes only, and have been anonymised so that we can share with the community.

Visual Communication
Animating Australian Catchments
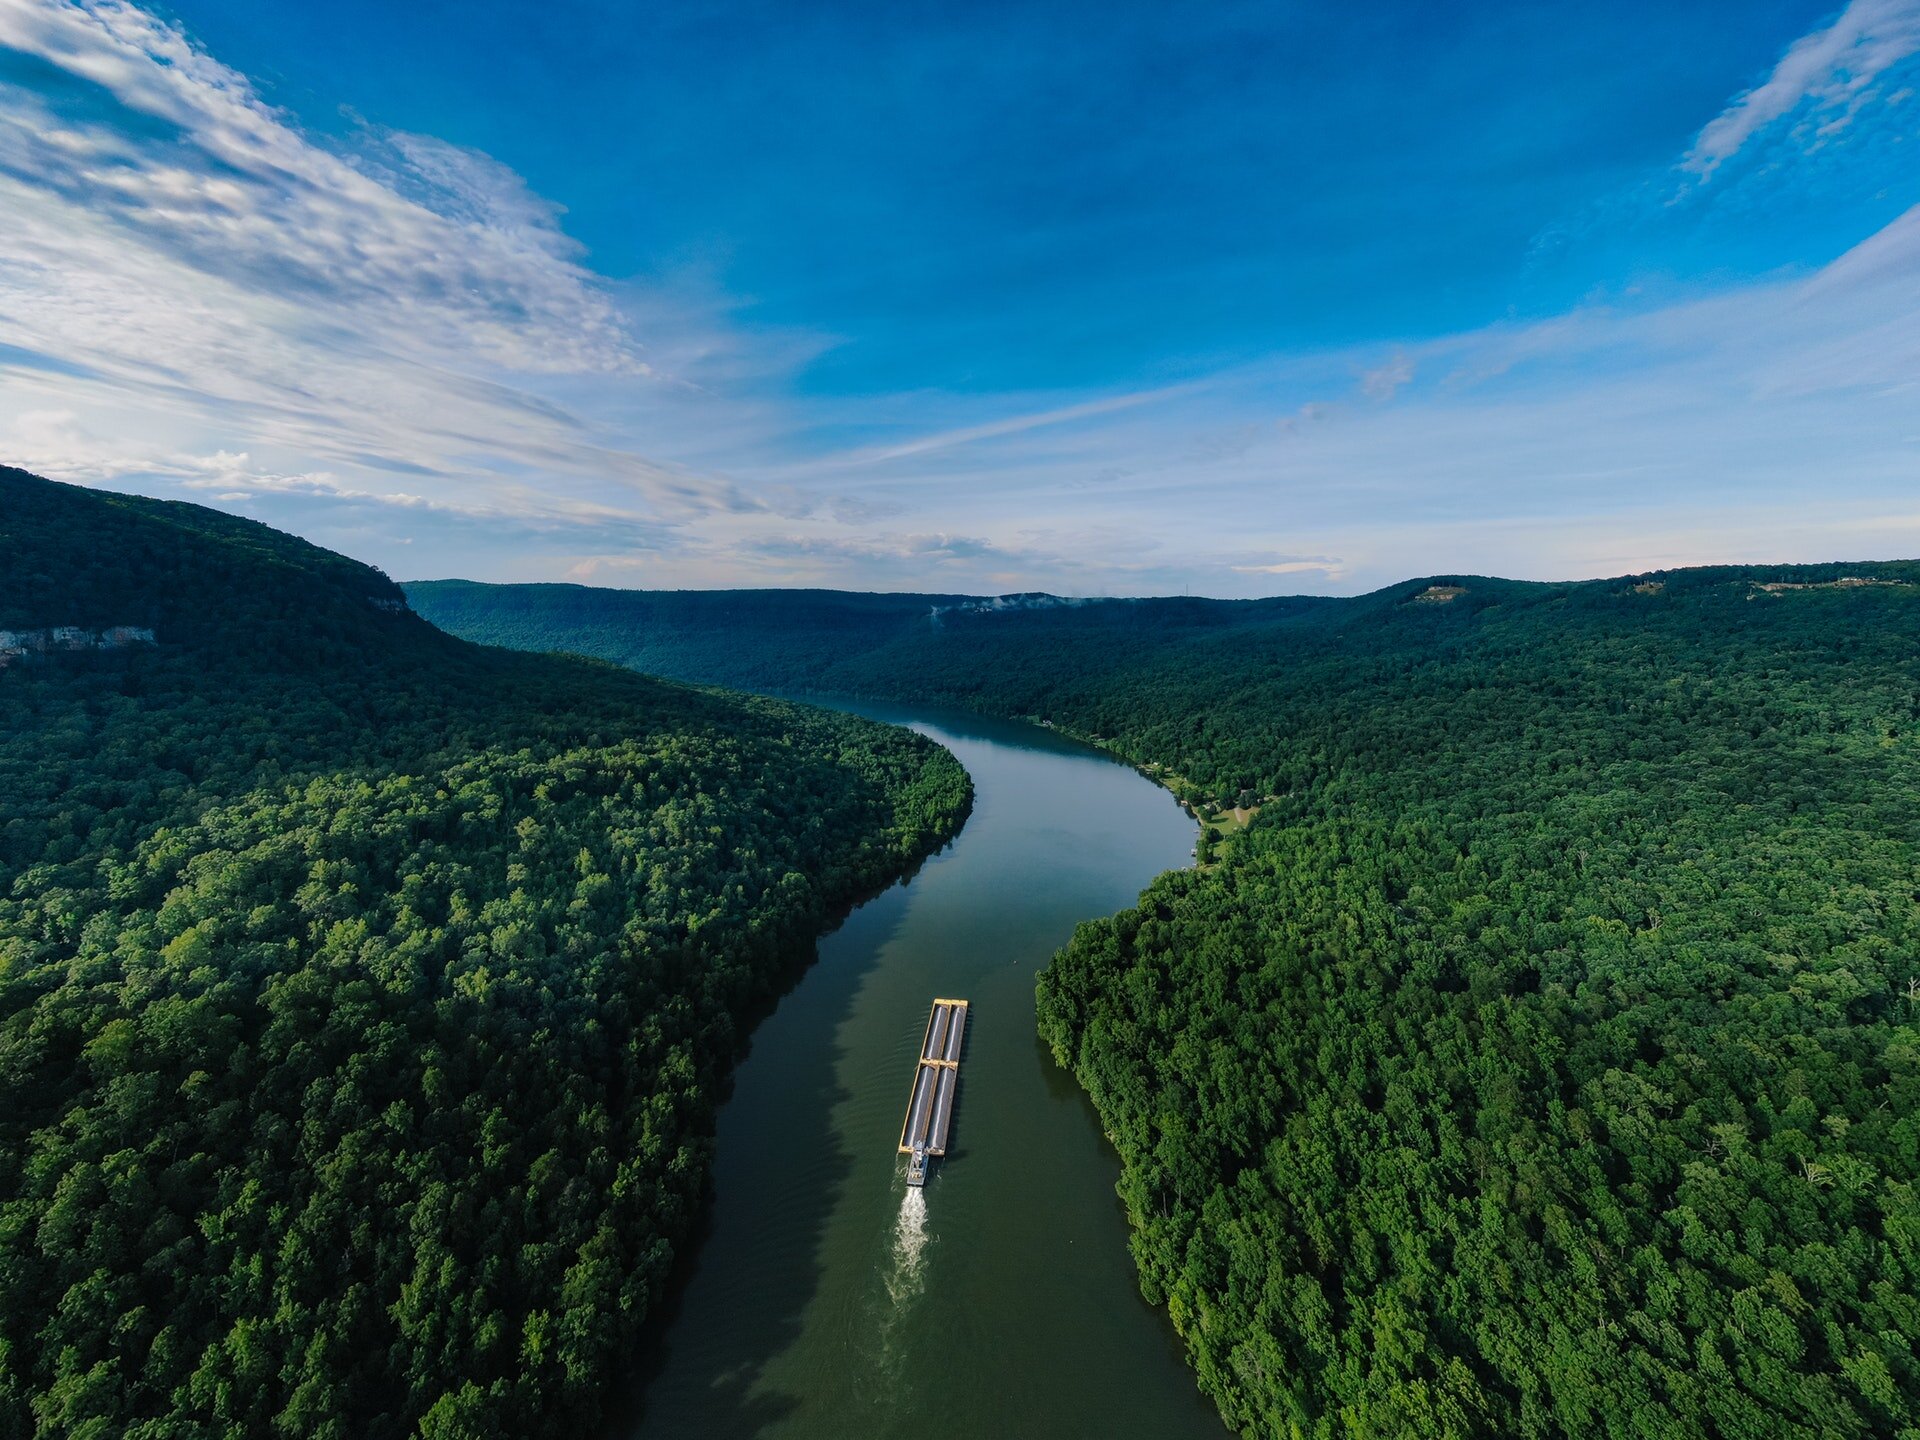
In 2019, we’ve just experienced another record breaking Australian summer, with January to April being the warmest period on record. DiscoverEI have been busy capturing these impacts on our water systems, combining aerial drone footage with animations and infographics to help our clients visualise and communicate their complex environmental systems.
Take a look at one of our case studies we’ve prepared for the major reservoirs within the Werribee system in Victoria.

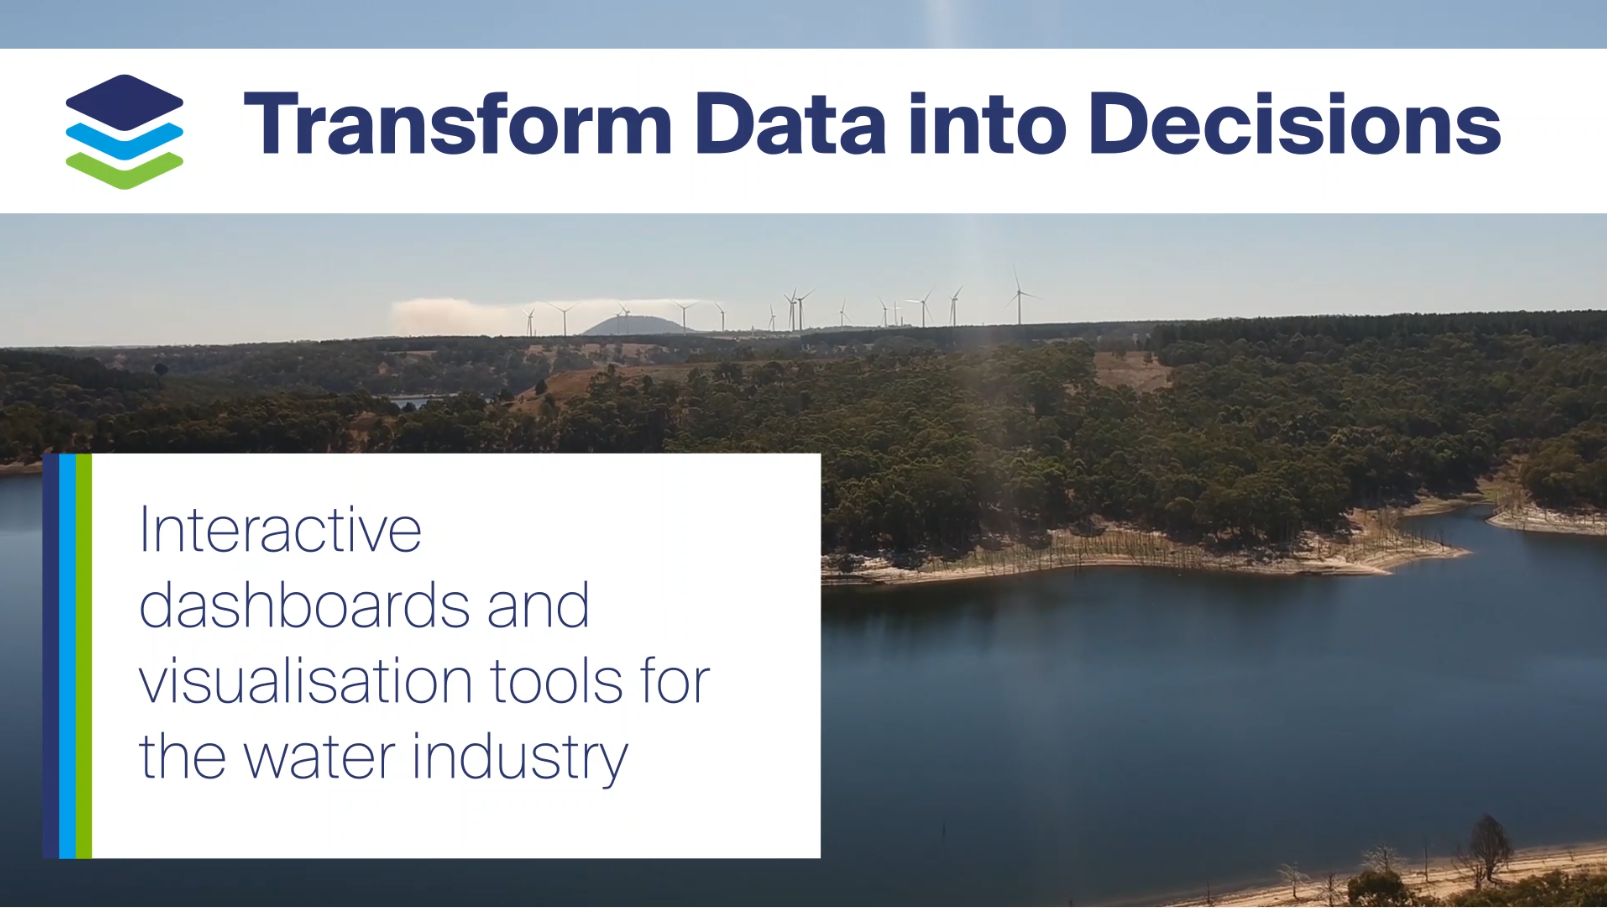
Water Resource Management
The water industry is literally drowning in data. At DiscoverEI we combine the latest business intelligence tools with computer animations facilitating a culture of data driven decision making across the water industry. Interactive dashboards are valuable decision support and communication tools, presenting a large volume of information in an accessible format to facilitate stakeholder engagement.
In this short video, we present a range of case studies where interactive dashboards have been applied across the water industry, to streamline data processing and create a shared understanding of our complex water systems to help secure a more sustainable future water supply.
Get in touch today to find out more
Connect
Follow us on Twitter, LinkedIn and Facebook!

About Us
Our mission is to bring environmental data to life!
We are passionate about using data analytics and visualisations to secure a more sustainable environment for tomorrow. We are a team of environmental engineers, data analysts and computer animators. Find out more about our team, what we stand for, and what sets us apart.


DiscoverEI’s Geological Bore Log custom visual for Power BI allows you to create interactive geological bore log cross-sections for your sites in a matter of minutes! Complete with groundwater level, screen information, consistent formatting and report page tooltips. Visualise your geology alongside all your other project information such as maps, monitoring data and photos in interactive Power BI reports.