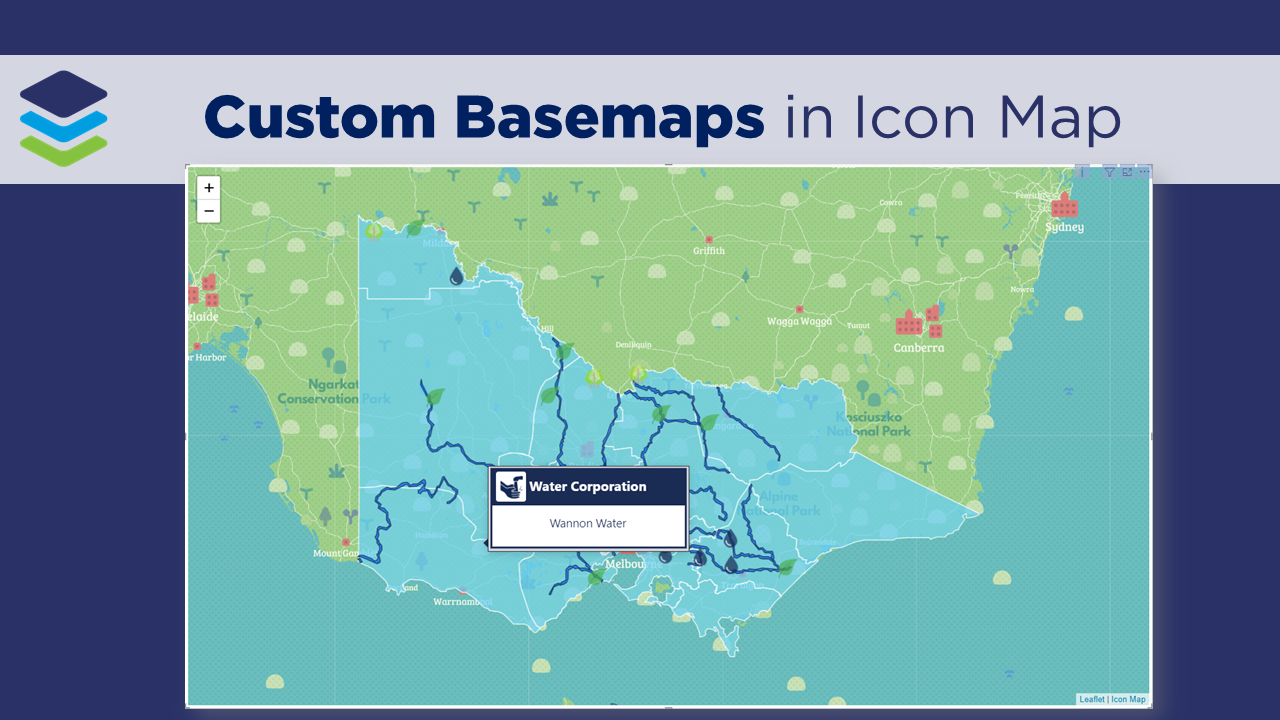
In this short video blog we walk through how to create custom basemaps in MapBox and integrate them into your Icon Map in Power BI! We then take it to the next level by configuring dynamic basemaps which we can change using slicers. A big shoutout and thanks to James Dales for creating this awesome visual!!
Read MoreIn this short video blog we walk through how to take Icon Map to the next level by incorporating WKT to plot custom points, lines and polygons, including a quick overview of how to convert your spatial files to WKT in QGIS. A big shoutout and thanks to James Dales for creating this awesome visual!!
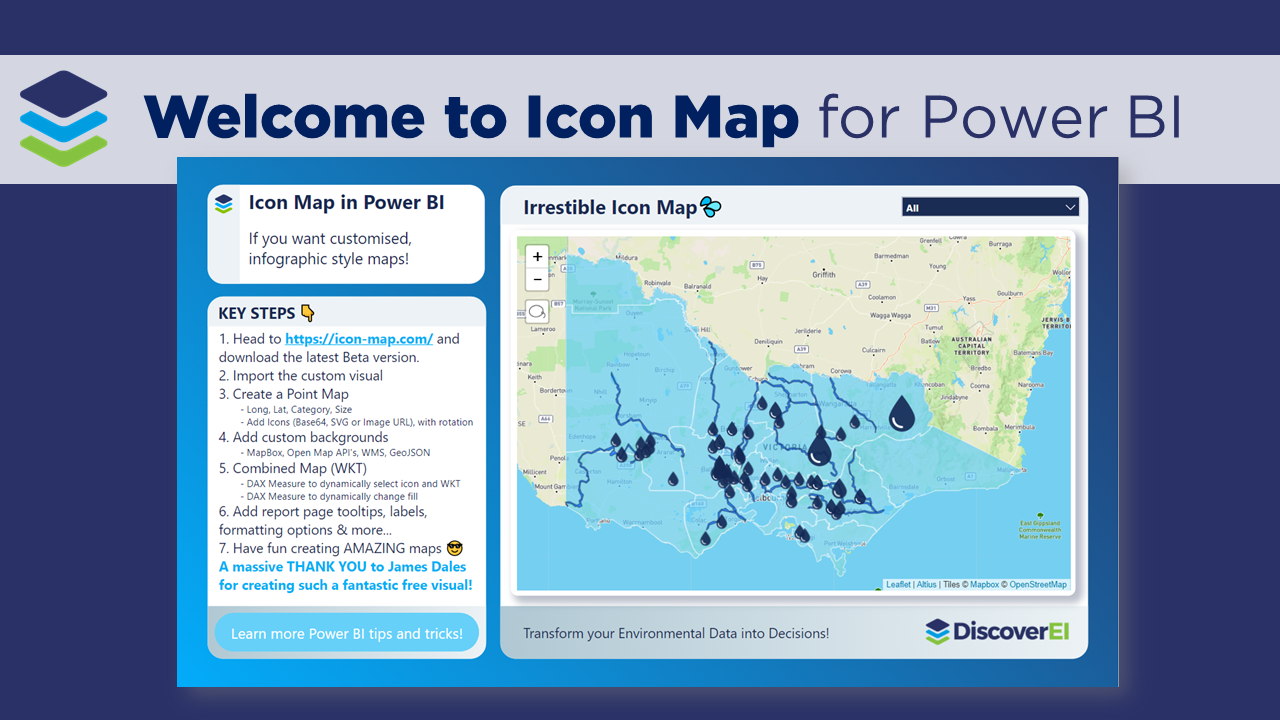
Read MoreIcon Map is hands down my favourite mapping visual for Power BI! In this short video I walk through how to get started creating your very first map with custom icons. A big shoutout and thanks to James Dales for creating this awesome visual!!
Read MoreWorking across the environmental industry – it’s fair to say that pretty much ALL of DiscoverEI’s Power BI reports have a map! And if you thought that MapBox was good, well you’re going to LOVE the Icon Map custom visual in Power BI – which allows you to display interactive polygons, points, lines and of course – icons, all in the one visual…plus so much more! To really appreciate how Icon Map can be used to visualize real world data, in this video blog I walk through two real-world applications of Icon Map to visualize environmental data. A big shoutout and thanks to James Dales for creating this awesome visual!!
Read More


